
The stock market is a dynamic battlefield where prices swing wildly, driven by a mix of investor sentiment, economic data, and corporate performance. But how do you know if a tumbling stock is a golden opportunity or a value trap? This is where valuation ratios come into play. These powerful tools help investors determine whether a stock is undervalued or overvalued, i.e., a bubble waiting to burst. Our previous blogs explored profitability ratios, liquidity ratios and solvency ratios as part of our ratio analysis series. Let us now understand the valuation ratios in this blog and why they are an important part of the fundamental analysis of stocks.
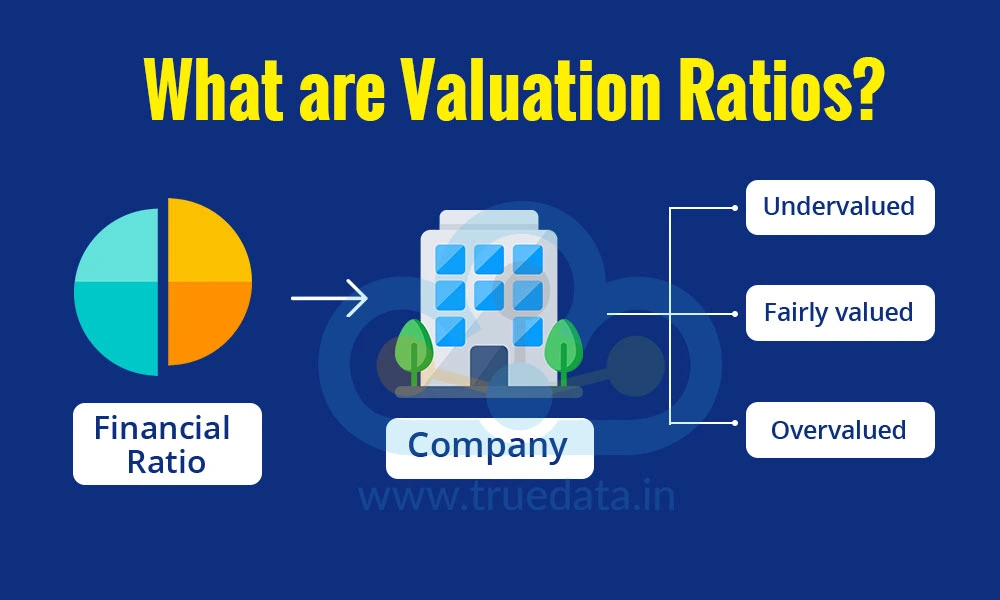
Valuation ratios are financial metrics used by investors to assess whether a company's stock is fairly priced, overvalued, or undervalued in the market. These ratios compare a company's current market price with various aspects of its financial performance, such as earnings, sales, or assets. These ratios are important in fundamental analysis because they help investors make informed decisions by comparing the stock price to the company's intrinsic value, earnings potential, and financial health. Valuation ratios can help in identifying attractive investment opportunities and avoiding overpriced stocks. These ratios are especially helpful in creating a long-term investment portfolio by identifying stocks that can help in wealth creation in the long run.
The purpose of valuation ratios is to compare the market value or the current price of the stock to various aspects of the company's financial performance to ascertain its financial health and help investors make informed investment decisions. Some of the popular valuation ratios include,
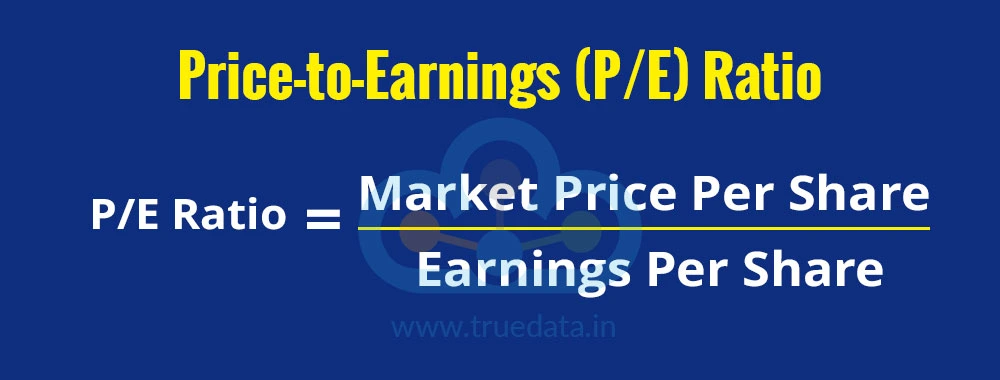
This is one of the most common valuation ratios that shows how much the investors are willing to pay for each rupee of the company’s earnings. A high P/E ratio may mean that a stock is expensive compared to its earnings, often because investors expect high growth in the future. A low P/E ratio may indicate an undervalued stock or one with weak growth prospects. Investors compare a company's P/E ratio with industry peers and historical averages as part of the fundamental analysis of stocks to determine its attractiveness. This ratio helps in comparing companies belonging to the same industry and gaining useful insights in identifying undervalued or overvalued stocks.
The formula to calculate the P/E Ratio is,
P/E Ratio = Market Price Per Share / Earnings Per Share
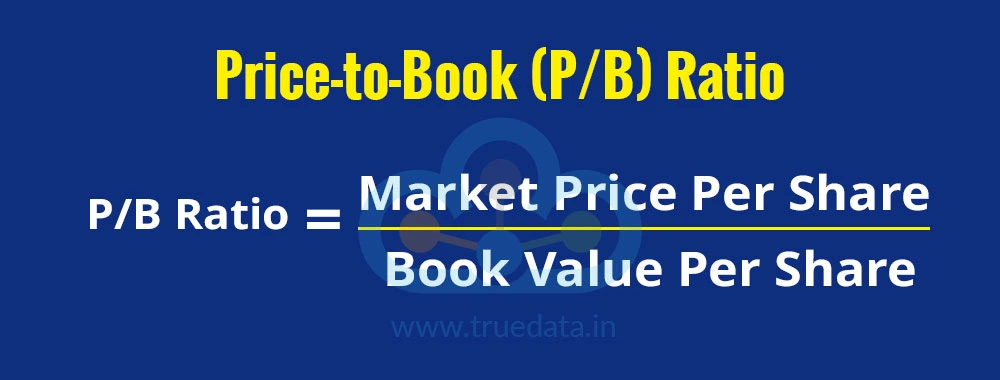
The PB Ratio compares the current stock price of the company to its book value per share. The book value per share is also known as the net asset value, which is derived after deducting all the liabilities of the company from its assets. A P/B ratio below 1 may suggest that a stock is undervalued. This implies that its market price is less than the actual value of the company's assets. On the other hand, a higher PB ratio may suggest strong investor confidence in the company’s future growth. However, this ratio is more useful for asset-heavy industries like banking, real-estate, and manufacturing.
The formula to calculate P/B Ratio is,
P/B Ratio = Market Price per Share / Book Value Per Share
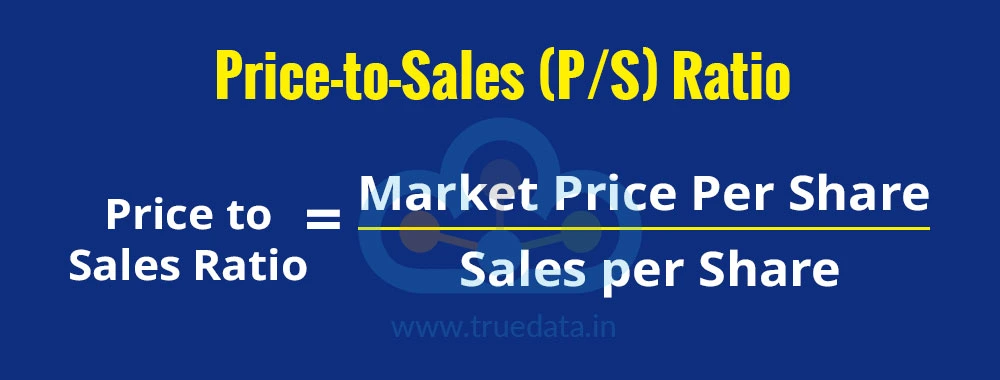
The price-to-sales ratio is another value ratio comparing the current stock price to the revenue per share of the company. This ratio can also be calculated by comparing the total market capitalisation of the company to its total revenue, giving a broader view of this ratio rather than the per-share value. This ratio essentially helps investors understand how much they are paying for each rupee of the company's revenue. A low P/S ratio may indicate an undervalued stock, while a high ratio suggests strong market expectations. This ratio is especially useful for companies with fluctuating profits or startups where the earnings or profits are initially inconsistent.
The formula to calculate the P/S Ratio is,
Price to Sales Ratio = Market price per share / Sales per Share
Or
Price to Sales Ratio = Market Capitalisation / Total Sales
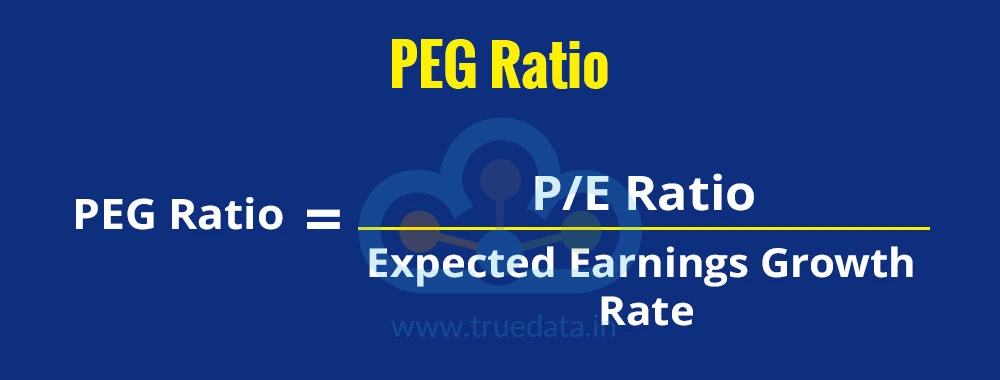
The PEG ratio is the refined version of the P/E Ratio as it accounts for the company's expected earnings growth rather than simply comparing its current price and earnings. A PEG ratio below 1 indicates an undervalued stock with strong future earnings potential, while a PEG above 1 suggests the stock may be overvalued. This ratio is, therefore, useful in comparing companies with different growth rates and can help investors find stocks with high potential at a reasonable price.
The formula to calculate the PEG Ratio is,
PEG Ratio = P/E Ratio / Expected Earnings Growth Rate
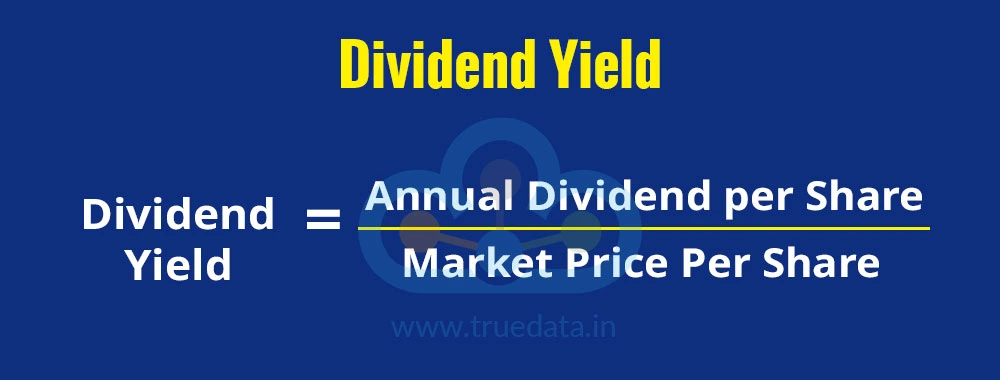
The dividend yield shows how much return an investor gets in the form of dividends compared to the stock price. It is an important ratio for income-focused investors. A high dividend yield suggests a company is rewarding investors with a steady income, while a low yield indicates the company reinvests profits for growth. Many investors look at this ratio when selecting stocks for passive income. However, it is important to note that a high dividend yield can be attractive, but it may also signal financial trouble if the company is paying high dividends despite low profits. Hence, it warrants further analysis using other parameters of fundamental analysis for accurate decision-making.
The formula to calculate Dividend Yield is,
Dividend Yield = Annual Dividend per Share / Market Price Per Share
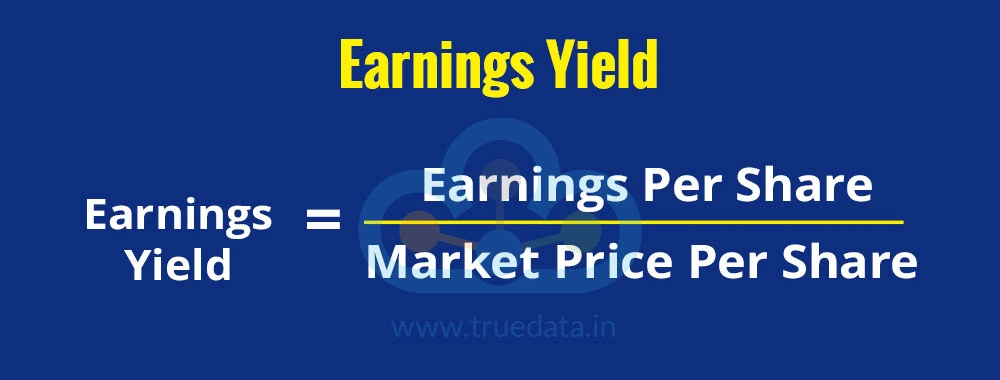
Earnings yield is the inverse of the P/E ratio and focuses on the return investors earn per rupee invested. A higher earnings yield suggests a potentially undervalued stock as it suggests better value for money. Investors can use this ratio in value investing where the focus is to find undervalued stocks or to compare returns from stocks to other investment options like fixed deposits or bonds.
The formula to calculate the Earnings Yield is,
Earnings Yield = Earnings Per Share / Market Price Per Share
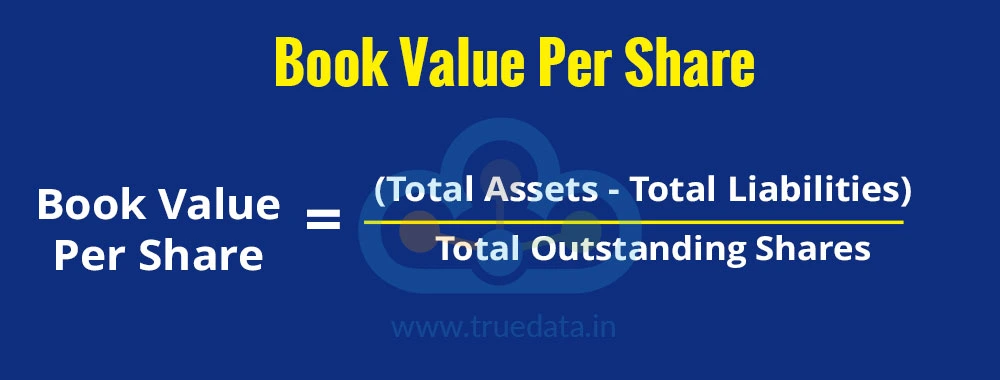
The book value per share highlights the networth of the company on a per-share basis. It is calculated by deducting the liabilities of the company from its total assets and represents the net asset value. This helps investors understand the actual value of a company's assets and its financial strength. A stock may be considered undervalued when the stock price is below its book value per share and vice versa. This ratio is, therefore, helpful for investors looking for value stocks and building a long-term portfolio.
The formula to calculate Book Value Per Share is,
Book Value Per Share = (Total Assets - Total Liabilities) / Total Outstanding Shares

Enterprise Value represents the total value of a company, including both debt and equity. By considering debt in its calculation, the enterprise value represents the more accurate measure of the company’s actual worth rather than simply considering the market capitalisation. The enterprise value helps in comparing companies with different levels of debt. It can also be used in mergers and acquisitions to determine a company's actual value as well as in finding undervalued companies with strong financial health.
The formula to calculate the Enterprise Value is,
EV = Market Capitalisation + Total Debt - Cash and Cash Equivalents
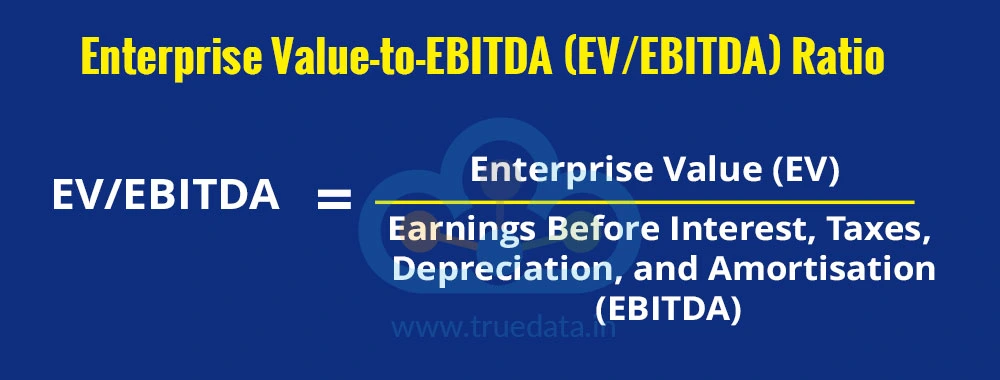
The EV/EBITDA ratio compares the Enterprise Value of the company to its earnings before deducting the interest, taxes, depreciation and amortisation. This ratio, therefore, compares the accurate valuation of the company to its actual earnings before adjusting the financial expenses and expenses due to accounting policies. A lower ratio suggests that a company might be undervalued, while a higher ratio indicates possible overvaluation. The ratio is useful in comparing the companies regardless of their capital structure. This ratio is widely used in evaluating capital-intensive industries like telecom, energy, and infrastructure.
The formula to calculate the Enterprise Value-to-EBITDA (EV/EBITDA) Ratio is,
EV/EBITDA = Enterprise Value (EV) / Earnings Before Interest, Taxes, Depreciation, and
Amortisation (EBITDA)
Valuation ratios are essential tools that help investors and companies understand the true value of a stock. They provide insights into whether a company’s stock is fairly priced, overvalued, or undervalued. The importance of valuation ratios for investors and companies is explained hereunder.

Valuation ratios can help investors in stock selection by comparing different stocks to find the best investment opportunities.
These ratios can help identify overvalued and undervalued stocks and compare different stocks in the same sector to determine which offers better value.
Investors can use these ratios to make informed investment decisions by analysing the financial health rather than relying only on stock price movements, thereby managing risk while earning stable returns.
These investors can be useful in both growth investing and value investing strategies as value investors look for low P/E and P/B ratios, while growth investors focus on the Price-to-Sales (P/S) and PEG ratios.

A company with strong valuation ratios is more likely to attract investors looking for profitable opportunities.
These ratios help in understanding the financial health and relative position of the company as compared to its peers.
A company with strong valuation ratios can raise capital from investors or banks as well as have better insight and control over pricing strategies, cost management, and expansion plans
Valuation ratios are most helpful for companies to evaluate potential mergers, acquisitions, or partnerships.
Valuation ratios are an integral part of the fundamental analysis of a company and are powerful tools that help investors understand whether its stock is fairly priced, undervalued, or overvalued. This helps them make informed portfolio decisions, identify strong companies, and balance risk and reward to build a profitable portfolio. The use of these ratios, along with other tools of fundamental and technical analysis, can help investors refine their investment strategies and have long-term success in the stock market.
This article is another addition to our series on ‘Fundamental Analysis of Stocks’. Let us know your thoughts on this topic or if you need further information on the same, and we will address it.
Till then, Happy Reading!
Read More: How to Read a Balance Sheet?
While the profitability of a company is one of its prime objectives, staying afl...

Fundamental analysis is the study or the dissection of the company data into qua...

One of the facts of stock market investing is having fundamental analysis as mor...