
One of the facts of stock market investing is having fundamental analysis as more or less the starting point of analysing a company for investment. While there are many aspects to fundamental analysis, ratio analysis is one of its core pillars. Investors can focus on many types of ratios that provide an in-depth analysis of the financial health of the company as compared to its competitors as well as the industry as a whole. Among these ratios profitability ratios are often the first to be focused on followed by solvency ratios, valuation ratios, operating ratios and more. We will focus on the profitability ratios in this blog and continue with others in the coming ones.
Read More: Difference between Shares and Bonds

The obvious answer to the meaning of profitability ratios is the assessment of the company’s profitability. Now let us get deeper into the meaning of profitability ratios. Profitability ratios are financial metrics that assess a company's ability to generate profit in relation to its revenue, assets, equity, or other financial metrics. These ratios provide valuable insights into a company's overall financial health and efficiency in utilising its resources to generate earnings.
They act as crucial indicators to having a snapshot of the earning potential of the company and thereby its sustainability. Some of the key profitability ratios include analysing the profit margins, Return on Equity (ROE), Return on Assets (ROA), and more. By monitoring the profitability ratios of a company an investor can understand the growth trajectory of the company and its relative position in the industry.
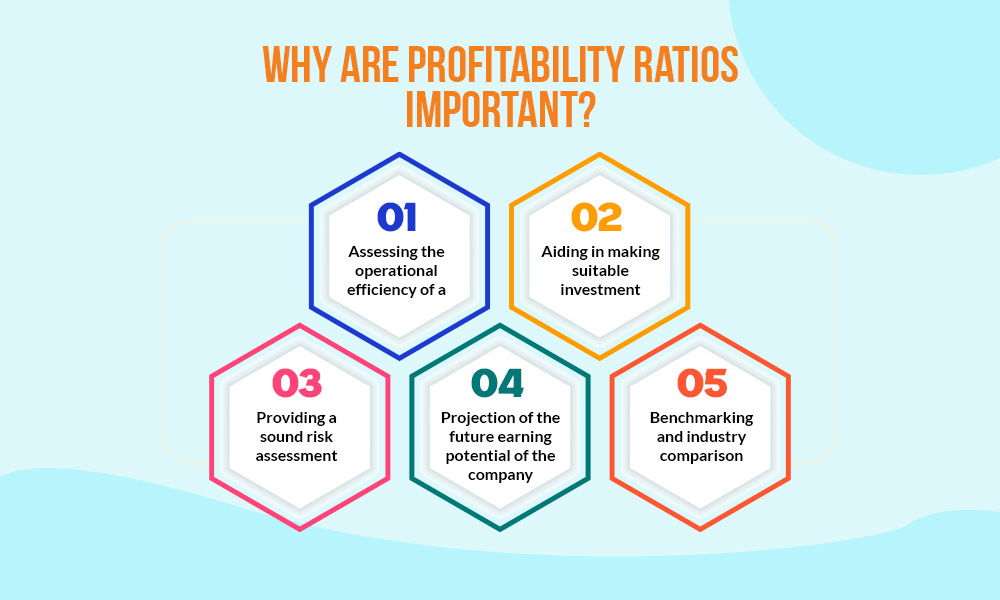
We have earlier mentioned that profitability ratios help in providing a better understanding of the financial health of a company. The importance of profitability ratios in detail can be explained hereunder.
Profitability ratios, such as Return on Assets (ROA) and Return on Equity (ROE), are vital for evaluating how efficiently a company utilises its resources to generate profits. A higher ROA indicates effective use of assets, while a superior ROE reflects efficient management in generating returns for shareholders. Investors should look for companies with consistent and improving operational efficiency, as it signifies effective resource utilisation.
Profitability ratios play a pivotal role in investment decision-making. Investors can compare profitability metrics across companies and industries to identify attractive investment opportunities. Companies with higher and more stable profitability ratios may be perceived as more favourable investment options, as they are likely to provide better returns over the long term.
Profitability ratios play a crucial role in risk assessment for investors. They serve as early warning indicators, with a declining net profit margin or return on equity (ROE) signalling potential financial challenges and increased risk. Additionally, ratios like gross margin and operating margin help investors understand specific risks, such as pricing pressures or rising production costs. Investors can thereby make informed decisions by closely monitoring these ratios that balance return potential with associated risks. This exercise contributes to a more comprehensive risk management strategy within their investment portfolios.
Profitability ratios serve as valuable indicators of a company's future earnings potential, particularly for investors seeking sustainable long-term investments. Consistently improving ratios, such as Earnings Per Share (EPS) and Net Profit Margin, suggest a positive trajectory for a company. This trend indicates the company's ability to withstand economic downturns and capitalise on growth opportunities. Investors can use these forward-looking indicators to project a company's future financial performance, enabling them to make informed decisions based on the expected earning potential and overall financial health of the investment.
One of the many benefits of analysing profitability ratios is its use for benchmarking and industry comparison. Comparing a company's profitability metrics with industry averages or competitors' performance can provide insight into the company’s relative position. This benchmarking process aids in identifying companies that outperform their peers, which can be valuable information for making strategic investment decisions in the market.
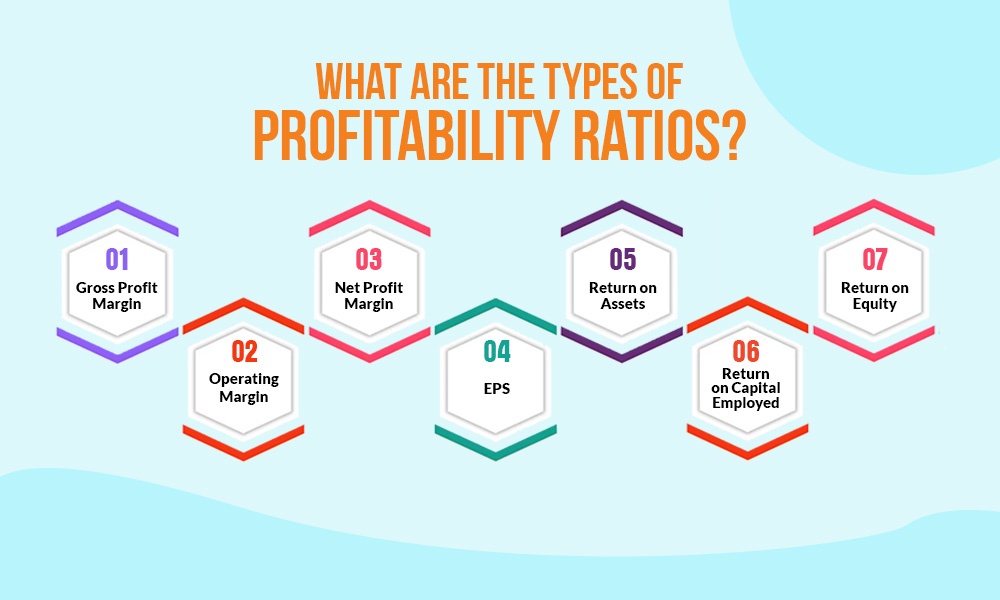
There are many profitability ratios that investors can analyse in the process of fundamental analysis of the company. Some of the common profitability ratios and their evaluation is explained hereunder.
Gross Profit Margin measures the percentage of revenue retained after accounting for the cost of goods sold. It reflects how efficiently a company manages its production costs.
The formula for calculating the Gross Profit Margin is,
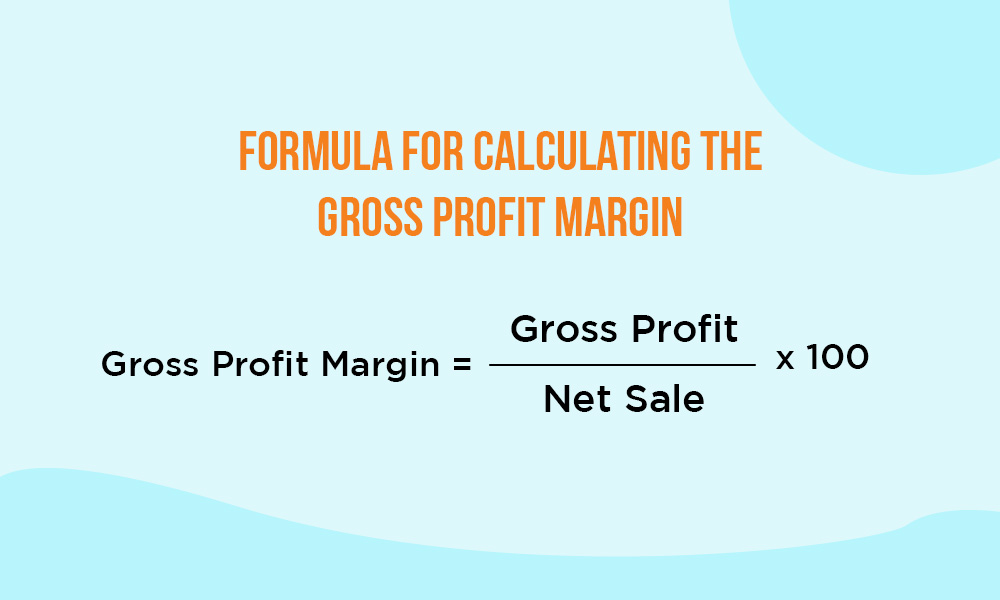
Gross Profit Margin = (Gross Profit / Net Sales) x 100
Investors commonly utilise the gross profit margin ratio to evaluate a company's proficiency in maintaining profitability at the production level. A higher gross profit margin is seen positively, indicating efficient cost management, effective cost control, or competitive pricing. This ratio reflects the profitability of the company's core production activities, making it a crucial metric for investors assessing a company's financial health.
Operating Margin assesses the profitability of core business operations by considering operating expenses.
The formula for calculating the Operating Profit Margin is,
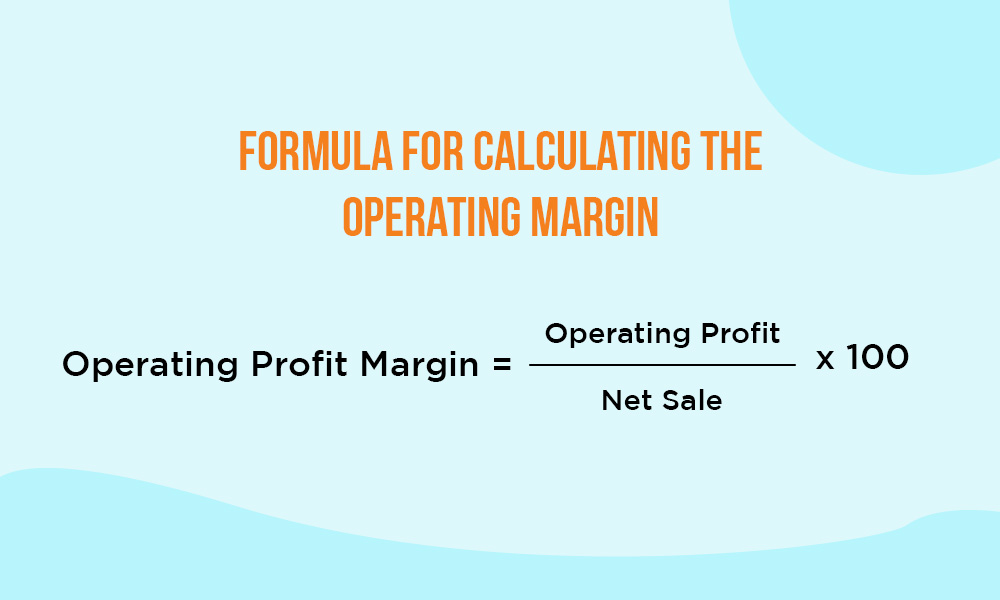
Operating Profit Margin = (Operating Profit / Net Sales) x 100
The operating margin ratio offers insights into a company's day-to-day operational efficiency. A higher operating margin is viewed positively, suggesting better operational management and profitability. This ratio indicates the company's ability to generate profits after covering core operational expenses, making it a valuable metric for assessing overall operational health and financial performance.
Net Profit Margin measures the portion of revenue that translates into net profit, considering all costs, including taxes and interest.
The formula for calculating the Net Profit Margin is,
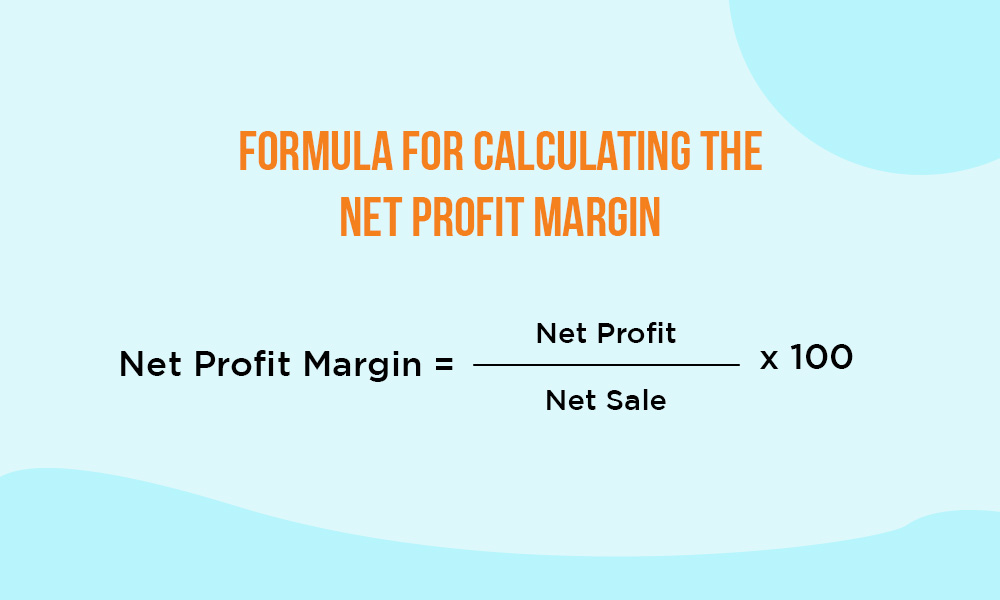
Net Profit Margin = (Net Profit / Net Sales) x 100
The net profit margin is a crucial indicator of a company's bottom-line profitability. A higher net profit margin is preferred, signalling effective cost management and overall financial health. This ratio reflects the company's ability to convert sales into profits by efficiently managing all costs, making it a valuable metric for evaluating financial performance and efficiency.
EPS represents the portion of a company's profit allocated to each outstanding share of common stock. It is crucial for assessing profitability on a per-share basis.
The formula for calculating the EPS (Earnings Per Share) is,
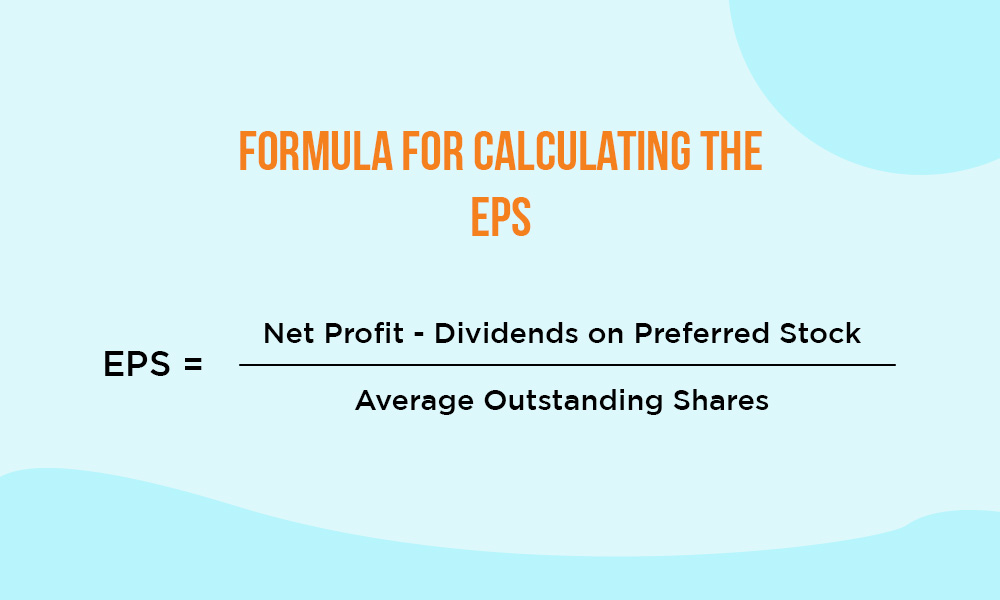
EPS = (Net Profit - Dividends on Preferred Stock) / Average Outstanding Shares
A higher earnings per share (EPS) is advantageous for investors, indicating greater returns for shareholders. Investors use EPS to assess a company's profitability on a micro level. A higher EPS suggests improved earnings potential while a lower or declining EPS suggests a risky investment option. This metric is crucial for evaluating a company's ability to reward investors and is a key factor in investment decision-making.
Return on Assets measures a company's ability to generate profit from its assets.
The formula for calculating ROA is,
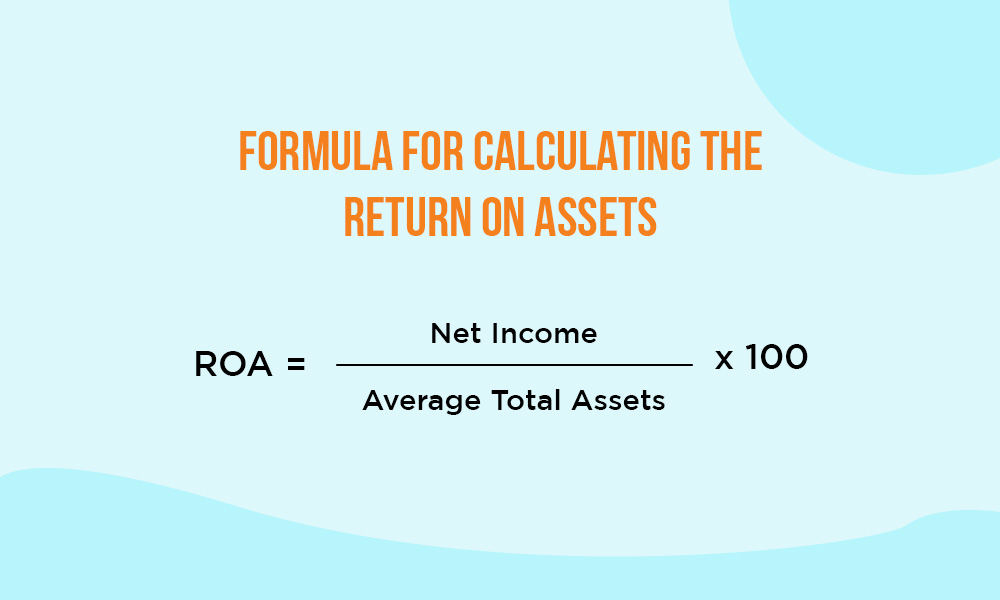
ROA = (Net Income / Average Total Assets) x 100
Indian investors rely on Return on Assets (ROA) to gauge a company's efficiency in utilising its assets for earnings generation. A higher ROA is considered positive, reflecting improved asset utilisation and efficient management. This indicator makes a company more appealing to investors as it signifies the effective use of resources to generate earnings.
ROCE measures profitability in relation to capital employed, providing insights into how well a company generates returns from its capital investments.
The formula to calculate ROCE is,
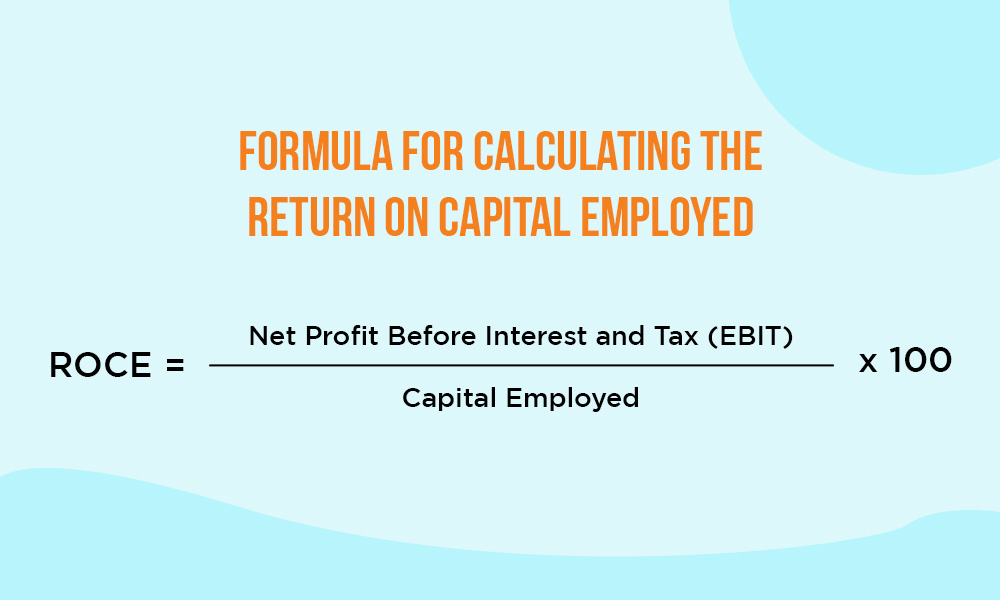
ROCE = (Net Profit Before Interest and Tax (EBIT) / Capital Employed) x 100
Indian investors use Return on Capital Employed (ROCE) to evaluate a company's effectiveness in generating returns from both equity and debt capital. A higher ROCE is seen as a positive indicator, reflecting efficient capital utilisation and effective management. This metric signals the company's ability to generate returns from its invested capital, making it an attractive investment option.
ROE measures a company's ability to generate returns for shareholders. It reflects the profitability from the perspective of equity investors.
The formula to calculate ROE is,
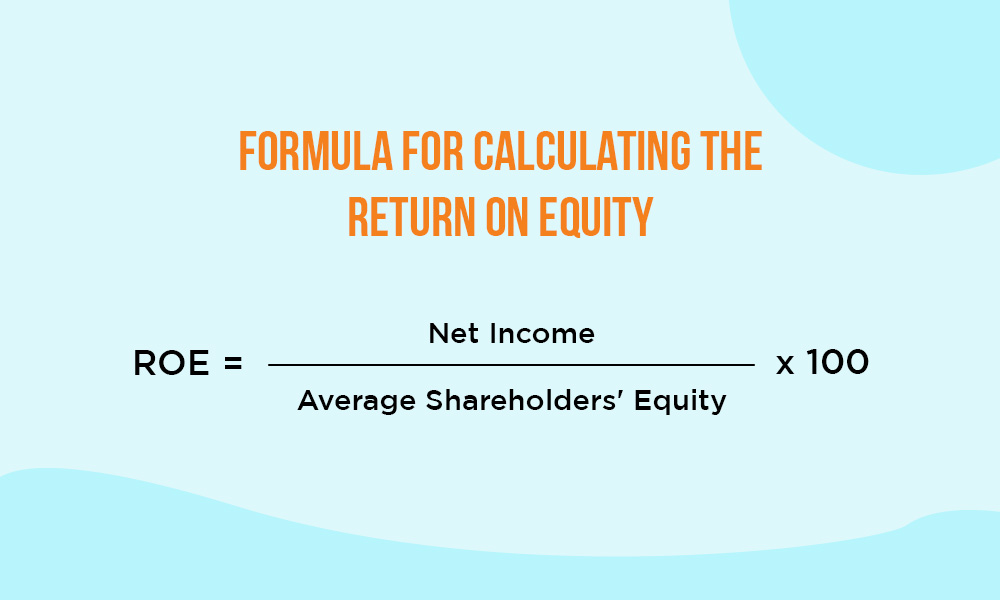
ROE = (Net Income / Average Shareholders' Equity) x 100
A higher ROE is favourable, indicating efficient utilisation of shareholder equity to generate profits and reward investors. It reflects the company's ability to translate shareholder investments into financial gains. This metric, therefore, serves as a positive signal for investors evaluating financial performance and shareholder value creation.
Profitability ratios are an effective measure of understanding the ability of the company to translate its resources into profits. It also showcases the growth potential of the company and its possible pitfalls which helps in making sound investment decisions.
This blog talks about the basics of profitability ratios and their interpretation for fundamental analysis of the company. Let us know if you have any queries regarding the same or need any more information on this topic.
Till then Happy Reading!
Read More: Best Historical Data Plugin for Traders

If you are a shareholder of a company, you would have seen its annual reports co...

Did you know more than 5000 companies are listed on theBSE and about 2000 on the...
Introduction Real Time Data from NSE, BSE & MCX is distributed to various d...