
India has seen a tremendous stock market boom in the post-COVID world and this has incentivised the entry of millions of retail investors. However, the key question for such new entrants is where to start. The first step of investment in stock markets is to analyse them correctly by understanding the basic concepts of fundamental and technical analysis. Here is a detailed step-by-step guide to understanding fundamental stock market analysis and the need for the same to help investors make sound investment portfolios.

Fundamental analysis of stocks is a method used to evaluate a company's financial health and its potential for future growth by examining various financial and economic factors. This involves looking at the company's financial statements, such as its balance sheet, income statement, and cash flow statement, to assess its profitability, revenue, expenses, and overall financial stability. Additionally, fundamental analysis considers external factors like the state of the industry, economic conditions, and market trends. Fundamental stock market analysis is important because it helps in making informed investment decisions to shape a profitable portfolio. By understanding a company's true worth and its growth potential, investors can choose stocks that are more likely to provide good returns over the long term, thereby reducing the risk of losses. This approach also helps in identifying undervalued stocks, offering opportunities to buy at a lower price and benefit as the market recognises their true value.

Qualitative and quantitative analysis are the two aspects of fundamental analysis for stock markets. The meaning and importance of these aspects are explained hereunder.
Quantitative analysis in fundamental stock market analysis involves examining numerical data and financial metrics of a company. This includes looking at financial statements to assess various ratios and figures, such as Earnings Per share (EPS), price-to-earnings (P/E) ratio, revenue, profit margins, and debt levels. Quantitative analysis helps in understanding the financial health and performance of a company through objective and measurable data. By analysing these numbers, investors can compare companies within the same industry, evaluate their growth potential, and make informed decisions about buying or selling stocks.
Qualitative analysis, on the other hand, focuses on non-numerical aspects of a company. This includes evaluating factors such as the company’s management team, brand reputation, competitive advantages, business model, and industry conditions. Qualitative analysis is crucial as it provides insights into the company's long-term sustainability and potential for growth that numbers alone cannot reveal. Understanding the quality of the company’s leadership, its innovation capabilities, and its market position helps investors gauge the company's prospects and resilience in changing market conditions.
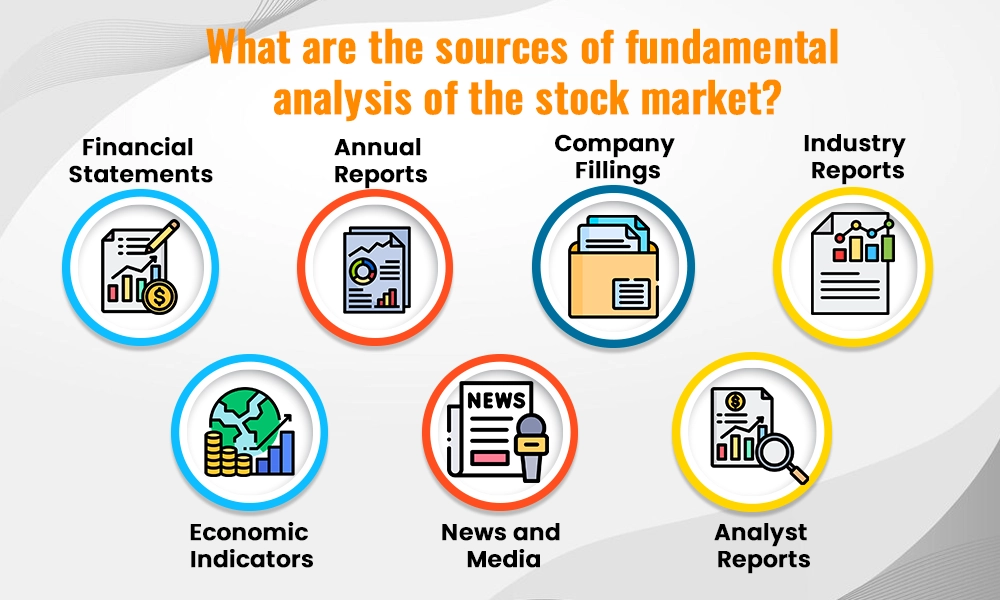
As mentioned above, share market fundamental analysis refers to a detailed analysis of the company’s stocks along with its future sustainability and growth prospects. In order to achieve this, investors aim to gather information about the company through various sources to analyse them effectively. Some of these sources of company analysis in fundamental analysis are mentioned below.
Financial statements are primary sources for fundamental analysis. They include the balance sheet, income statement, and cash flow statement. The balance sheet provides a snapshot of a company's assets, liabilities, and shareholders' equity at a specific point in time. The income statement shows the company's revenue, expenses, and profits over a period, indicating how well the company is generating income. The cash flow statement highlights how the company manages its cash, including operations, investments, and financing. These documents are essential for assessing a company's financial health and performance.
Annual reports are comprehensive documents published by companies to inform shareholders about their activities and financial performance over the past year. These reports include the financial statements, as well as management's discussion and analysis (MD&A), which provides insights into the company’s operations, market conditions, and future outlook. Annual reports offer valuable information about a company's strategy, risks, and opportunities.
Company filings are documents that publicly traded companies are required to submit to regulatory authorities like the Securities Exchange Board of India (SEBI) and the stock exchanges. These key filings include quarterly earnings reports, disclosures of significant events, and corporate governance reports. Company filings help investors stay updated on the latest developments and regulatory compliance of the company, aiding in making informed investment decisions.
Industry reports provide analysis and data on specific sectors of the economy. These reports, often produced by research firms and industry associations, include trends, market conditions, and forecasts. Understanding the broader industry context is crucial for evaluating how a company is positioned within its sector and how external factors might impact its performance.
Economic indicators are statistics that reflect the overall health of the economy. Key indicators include GDP growth rates, inflation rates, interest rates, and employment figures. These indicators provide insights into the economic environment in which companies operate. Understanding these macroeconomic factors helps investors predict market trends and make better investment decisions.
News and media sources provide timely information about companies, industries, and the economy. This includes newspapers, financial websites, and television channels. Staying updated with the latest news helps in reacting swiftly to market developments and understanding the broader context of their investments.
Analyst reports are expert reports prepared by financial analysts and brokerage firms. These reports provide detailed evaluations of companies, including buy or sell recommendations, target prices, and in-depth analysis. Analyst reports can offer expert insights and complement their research, helping them make more informed investment choices.
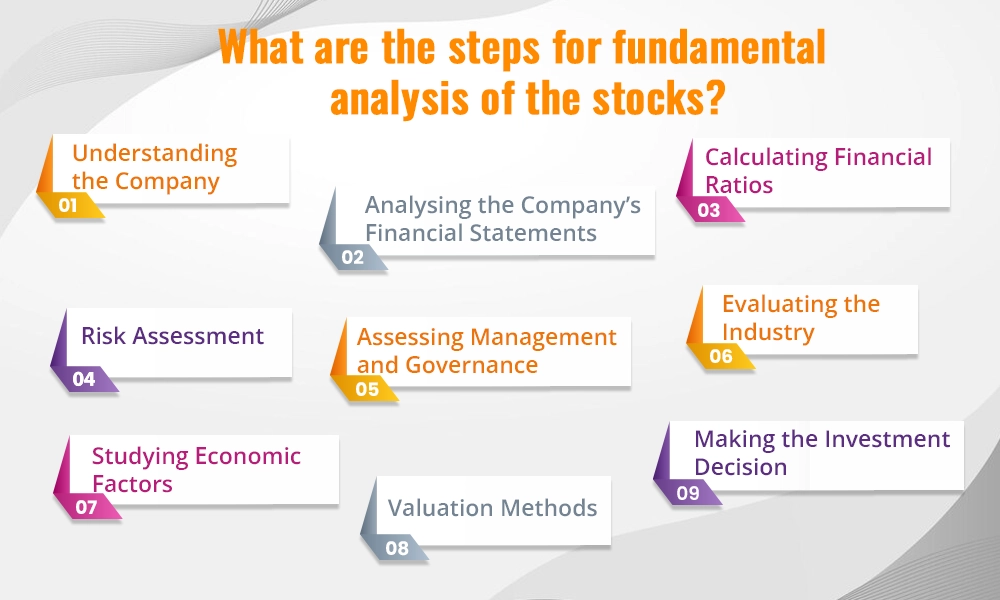
Fundamental analysis is a detailed process of understanding the true value or the intrinsic value of the company, its profitability combined with its future prospects. This process involves various stages of analysis and is explained hereunder.
Learn About the Business by understanding what the company does and how it makes money.
Know the Industry and the company's position within its industry along with its main competitors.
Balance Sheet - Check the company’s assets, liabilities, and shareholders’ equity to get a snapshot of the company’s financial health.
Income Statement - Review the company’s revenue, expenses, and profits over a specific period to analyse the company's performance.
Cash Flow Statement - Analyse the cash inflows and outflows to understand the company’s liquidity and long-term solvency.
Profitability Ratios - Calculating profitability ratios like Return on Equity (ROE) and Net Profit Margin shows how well the company generates profits.
Liquidity Ratios - Liquidity Ratios such as the Current Ratio and Quick Ratio should be used to assess the company’s ability to meet short-term obligations.
Valuation Ratios - Valuation ratios like Price-to-Earnings (P/E) and Price-to-Book (P/B) ratios help in determining if the stock is overvalued or undervalued.
Business Risks - Identify risks related to the company’s business model, competition, and market demand.
Financial Risks - Assess risks related to debt levels, interest rates, and currency fluctuations.
Market Risks - Consider risks from market volatility, economic downturns, and geopolitical factors.
Management Team - Evaluate the experience and track record of the company’s management team to ensure the company has good leadership as it is crucial for the company’s success.
Corporate Governance - Check the company’s governance practices, board composition, and any potential conflicts of interest that can potentially damage the future of the company.
Industry Analysis - Understand the industry in which the company operates to understand the trends, competition, and the overall market environment.
Competitive Positioning - Identify the company’s market share and competitive advantages, such as unique products or technology.
Economic Indicators - Consider macroeconomic factors like inflation, interest rates, and GDP growth as they can impact the company’s performance.
Regulatory Environment - Understand the regulatory landscape and any government policies that could affect the company.
Discounted Cash Flow (DCF) Analysis - Estimate the company's future cash flows and discount them to their present value.
Price to Earnings (P/E) Ratio - Compare the company’s P/E ratio with industry averages or historical P/E ratios.
Price to Book (P/B) Ratio - Compare the market value with the book value of the company.
Intrinsic Value vs. Market Price: Compare the intrinsic value with the market price of the stock to determine if the stock is undervalued, overvalued, or fairly valued.
Diversify - Spread the investments across different stocks and sectors to reduce the overall portfolio risk.
Long-term Perspective - Invest with a view towards the long-term potential of the company to benefit from wealth creation in the long term.
Fundamental analysis empowers investors by providing a comprehensive understanding of a company’s financial health and intrinsic value. However, there are a few limitations to this process too. Here is a list of a few pros and cons of fundamental analysis for the stock market.
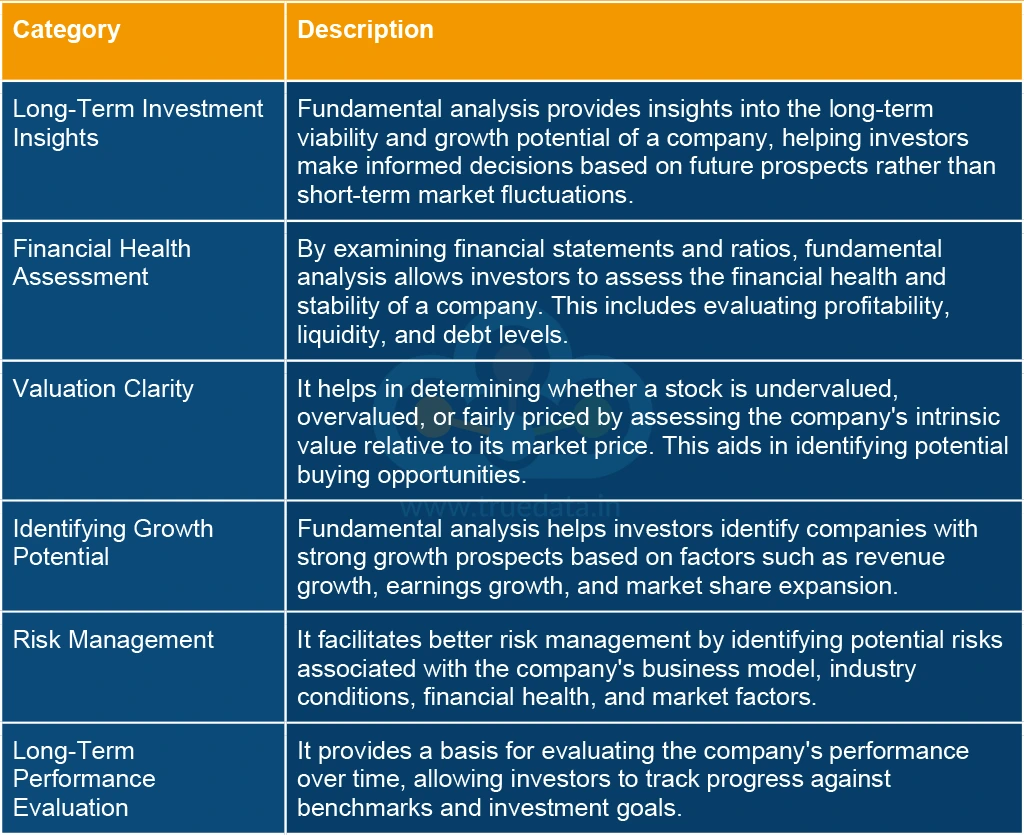
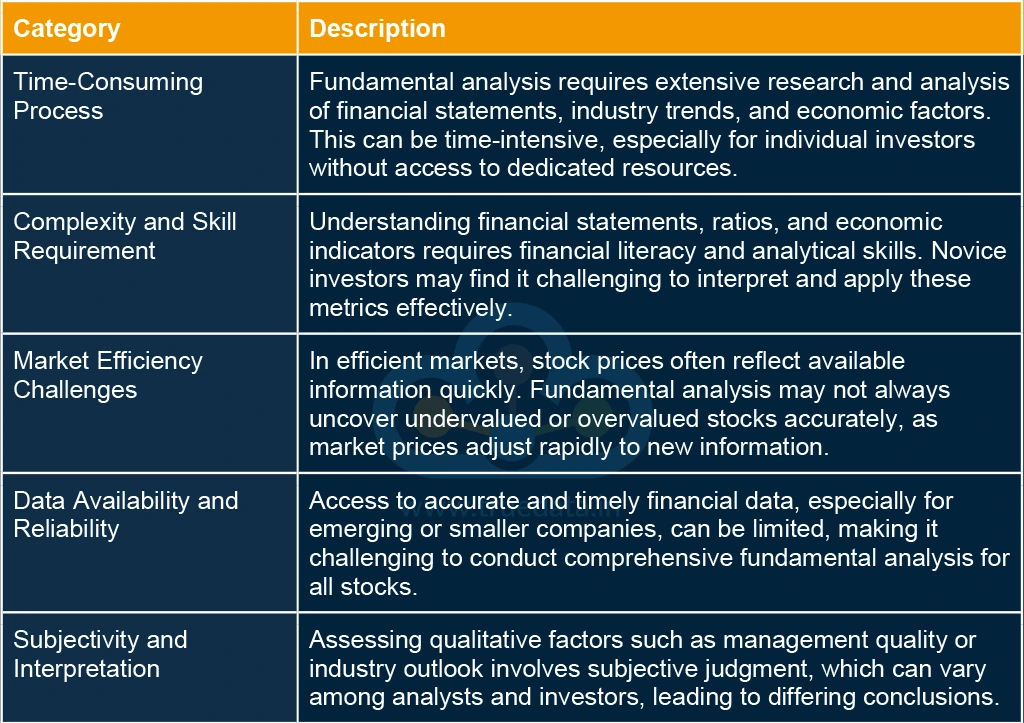
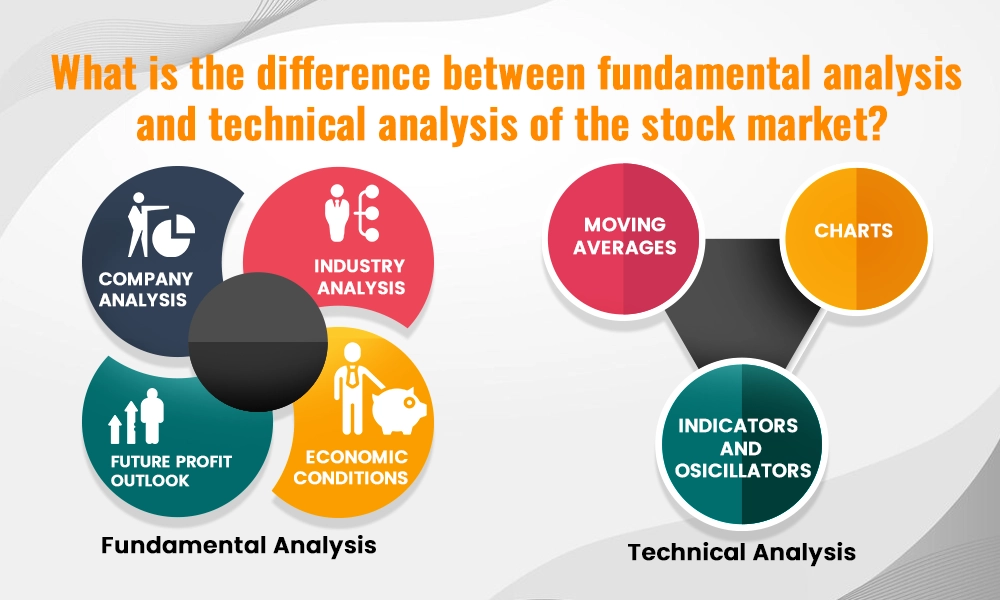
Fundamental analysis and technical analysis are contrasting methods used by investors to evaluate stocks in the stock market. Fundamental analysis involves assessing a company's intrinsic value by examining factors like financial statements, earnings growth, industry position, and economic factors like GDP growth and inflation. It aims to determine if a stock is undervalued or overvalued relative to its actual worth, making it suitable for long-term investors who prioritise understanding the fundamental strength and growth potential of a company.
In contrast, technical analysis focuses on studying historical price and volume data to predict future price movements. It uses charts, patterns (like support and resistance levels), and technical indicators (such as moving averages and RSI) to identify trends and timing for buying or selling stocks. Technical analysis is favoured by short-term traders who believe that market psychology and price trends can provide insights into optimal entry and exit points for trades, emphasising short-term profit opportunities over long-term company fundamentals.
Fundamental stock market analysis is one of the key pillars of the investment journey. It provides investors with a solid framework to assess the long-term potential and financial health of companies. While it requires time and skill to master, fundamental analysis helps investors build a solid foundation for making strategic investment choices aligned with their financial goals.
We hope this comprehensive guide on fundamental analysis was helpful in shedding light on the basics of fundamental analysis and why it is essential for every investment portfolio.
Let us know if you need further information on this topic or any aspect of fundamental analysis and we will take it up in our coming blogs.
Till then Happy Reading!
Read More: Red Flags to Watch Out for While Analysing a Company’s Stock

Thestock market never stands still, and prices swing constantly with every new h...

The stock market in India has fascinated general Indian masses for long, perhap...

The Japanese Yen (JPY) has long been one of the world’s major currencies, ...