The year 2025 began with the news of another virus adding to the uncertainty in the Indian stock markets and wiping out nearly Rs. 9.5 lakh crores in investor wealth. While this dip will make most investors wary of stock markets, seasoned players know that buying the dip is the route to wealth creation in the long term. To meet this, the emphasis should be on analysing the fundamentals of companies before investing and the starting point is their financial statements. We have talked about the importance of annual reports in the fundamental analysis of stocks and continuing with the series, here is the first step in the process, i.e., analysing the balance sheet. Check out this blog to learn more about the balance sheet of a company and its significance in the fundamental analysis of stocks.
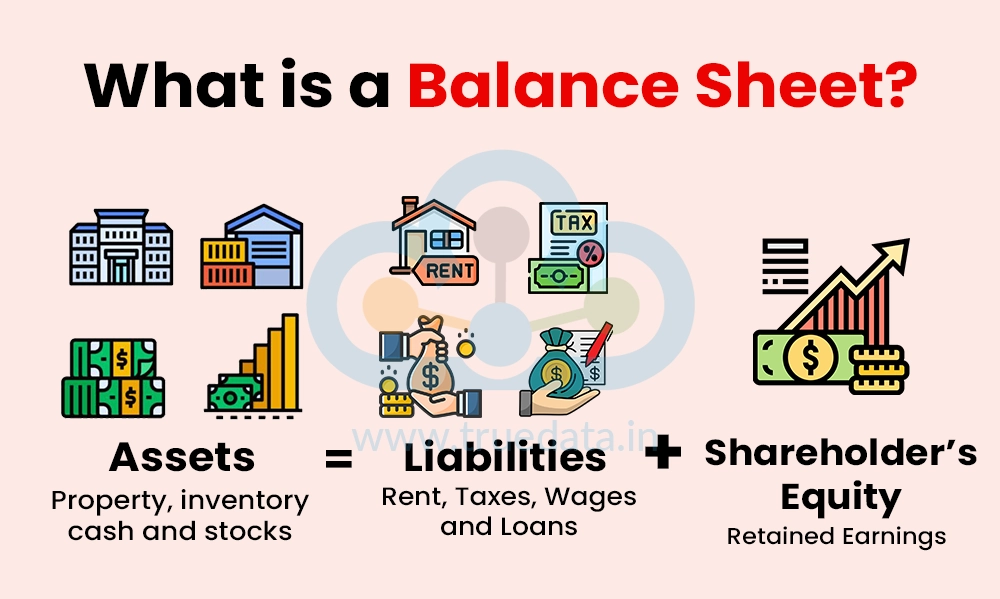
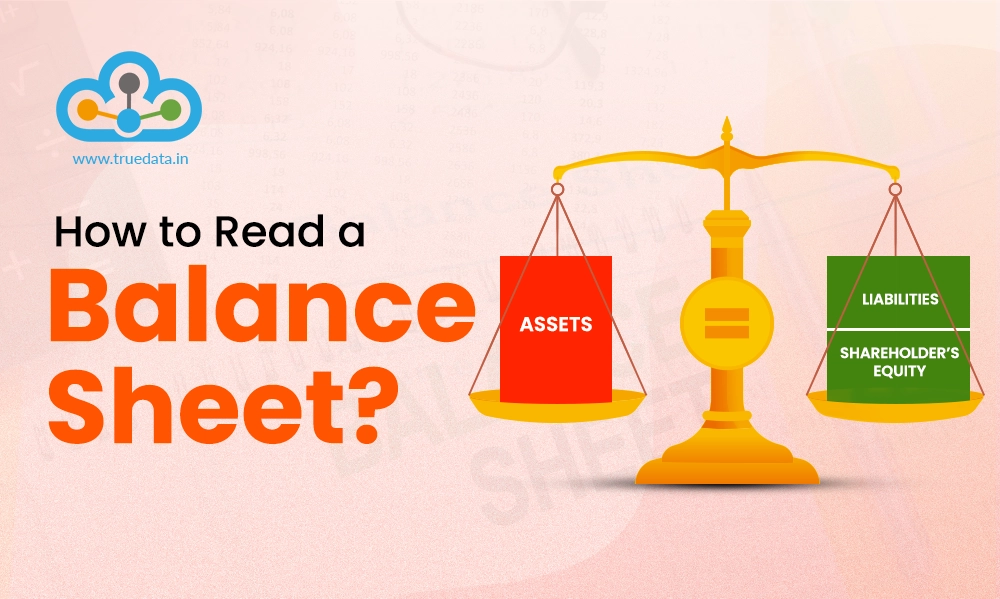
A balance sheet is the first part of the financial statements of a company and gives the financial position of the company on a particular date usually the last date of a financial year. Balance sheets are also made for interim periods like a quarter or a semi-annual period of the financial year. This statement shows the position of the assets and liabilities along with the shareholder’s equity as of the balance sheet date. The fundamental rule of a balance sheet is that it should always balance and the simple formula that the balance sheet is based on is,
Assets = Liabilities + Shareholder’s Equity
It is important for investors as it provides a snapshot of the company’s financial position and helps assess its stability and ability to generate profits. A standalone balance sheet on its own can provide limited information to investors and other stakeholders. Hence, it is important to compare the same with the balance sheets of peers or past balance sheets of the organisation of corresponding periods for better analysis of trends, profitability, debt levels, etc.
A balance sheet is represented in either a horizontal format or a vertical format as per Schedule III of the Companies Act, 2013.
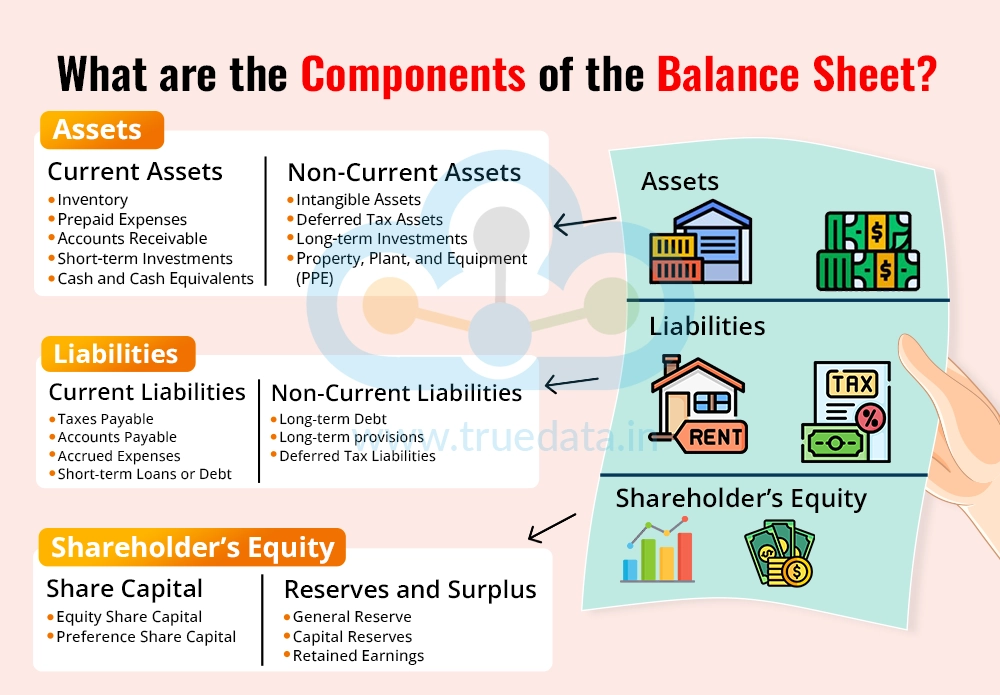
The balance sheet is essentially classified into three main components, i.e., the assets, liabilities and the shareholder’s equity. These components are further classified into various subcomponents to signify different aspects of the organisation. The details of the balance sheet components are explained hereunder.
Assets are the resources that the company owns or controls and uses to generate income. They are divided into two main categories, i.e., Current Assets and Non-Current Assets.
Current assets are short-term resources that can be converted into cash or used up within one year. These asses help the company manage day-to-day operations. The examples of assets includes,
Cash and Cash Equivalents - This section includes the most liquid form of assets, such as cash in hand or money in the bank.
Accounts Receivable - This is the money owed to the company by customers or debtors who have purchased goods or services but are yet to complete payment. The company expects to receive these payments within the stipulated debtor days.
Inventory - This section includes finished goods ready to be sold or raw materials for production.
Short-term Investments - These assets are investments of the company that can be converted to cash within a year, such as bonds or mutual funds, etc.
Prepaid Expenses - This section includes the payments made by the company in advance for services, like paying rent or insurance before using them.
These assets are long-term resources of the company that are used to run its business and generate revenue. The type of assets included here are,
Property, Plant, and Equipment (PPE) - These are physical items like buildings, machinery, and land which are directly or indirectly used for the business of the company.
Intangible Assets - This section includes non-physical items like patents, trademarks, or goodwill that add value to the company.
Long-term Investments - These are investments made by the company with the intention to hold them for more than a year, such as shares in another company.
Deferred Tax Assets - This is a notional asset recorded in the books of the company that can arise from overpaying taxes or losses and can be used to reduce future tax bills.
Liabilities represent funds that the company owes to others. They are the company’s obligation to pay money or provide services in the future. Similar to assets, they are also divided into Current Liabilities and Non-Current Liabilities.
These are short-term obligations that must be settled within one year. Some key examples include,
Accounts Payable - This is money that the company owes to suppliers for goods or services it has already received. The payment for the same is to be made within the stipulated credit days as agreed with the creditor.
Short-term Loans or Debt - These are the short-term borrowings that need to be repaid within a year, such as a working capital loan.
Accrued Expenses - This section includes the expenses that the company has incurred and is yet to make actual payments for the same, like salaries for employees, rent, etc.
Taxes Payable - This is the tax liability of the company that it owes to the government and is to be paid.
These are long-term obligations that are due after more than a year. Some key examples include,
Long-term Debt - This can account for a significant portion of the borrowed funds of an organisation and includes loans or bonds the company needs to repay over several years.
Deferred Tax Liabilities - This section accounts for the taxes the company will owe in the future due to differences in accounting methods.
Long-term provisions - This portion includes the amount set aside by the company to meet its future obligations like employee benefits, warranty obligations, obligations relating to pending lawsuits, etc.
Shareholder’s Equity is the value left for the company’s owners after all liabilities are deducted from its assets. It represents the shareholders’ stake in the company. It has the following key components:
This represents the owner’s funds and is the money raised from issuing shares to investors. It includes,
Equity Share Capital - These are funds raised by issuing ordinary shares. Equity shareholders are considered the true owners of the company and also have voting rights.
Preference Share Capital - These represent funds raised by issuing preference shares or shares that give priority to receiving dividends over equity shares. Preference shareholders do not have voting rights and also have a priority to receive funds at the time of liquidation over equity shareholders.
Reserves and surplus represent the accumulated profits of the company that are used for growth, declaring dividends, and meeting statutory obligations or emergencies. There are many types of reserves which include,
Retained Earnings - These are the net profits that the company reinvests in its business rather than paying them out to shareholders.
General Reserve - These represent funds set aside for unforeseen expenses or expansion as well as declaring dividends.
Capital Reserves - These are reserves created from non-operating activities, such as selling assets at a profit.
The balance sheet is an essential part of the fundamental analysis of a company and can be used for analysing important ratios to gain insights into key metrics of the organisation. These ratios can give an idea of the company’s financial health, helping investors make better decisions.
Some of the top ratios to be analysed using the balance sheet include,
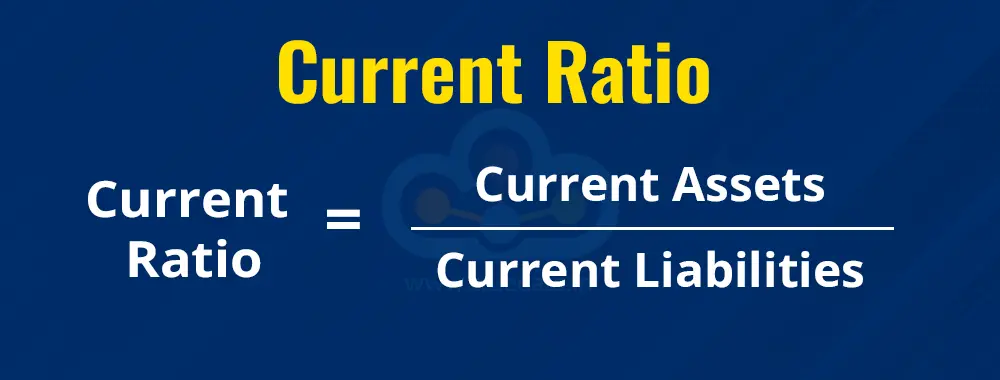
This is one of the basic ratios for analysis and measures a company’s ability to pay its short-term obligations using its short-term assets. It shows whether the company has enough resources to manage its day-to-day financial needs. The formula to calculate the same is,
Current ratio = Current Assets / Current Liabilities
While there is no standard current ratio for every industry, as a rule of thumb the current ratio of 2 is considered to be ideal for any organisation. It indicates that the company can cover its short-term liabilities with its current assets, showing good liquidity. However, if the current ratio is too high, it can indicate that the company may not be using its assets efficiently while a lower current ratio can indicate financial instability
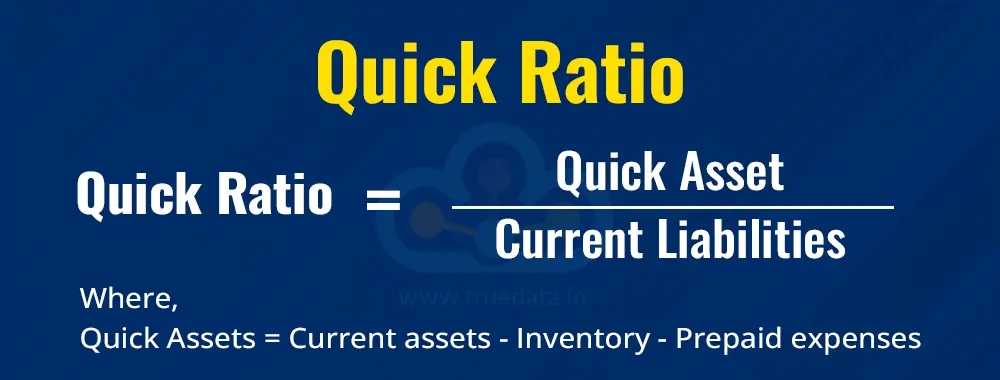
The quick ratio is a stricter measure of liquidity as it excludes inventory and prepaid expenses from the calculation to give the true financial position of a company at the balance sheet date. The formula to calculate this ratio is,
Quick ratio = Current Assets - Inventory - Prepaid Expenses / Current Liabilities
The ideal quick ratio for most industries is considered to be 1 which indicates that the company is able to meet its short-term obligations even without selling inventory. This ratio is especially important for industries or companies with slow-moving investors as it gives a better insight to the relevant stakeholders of the financial viability of the company.
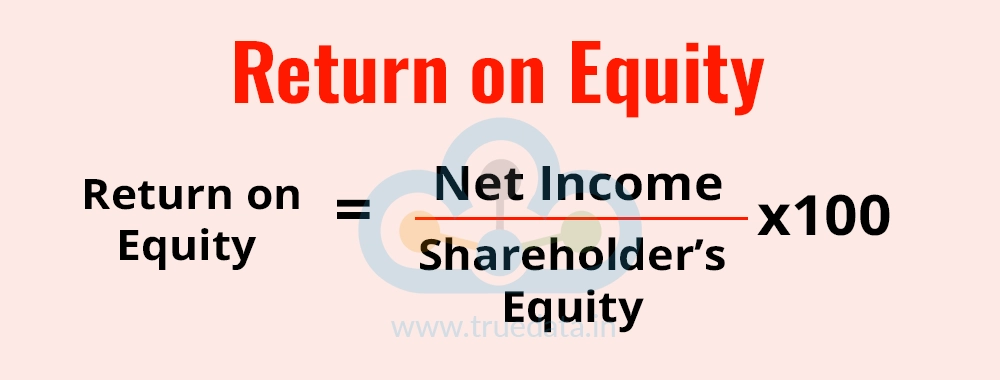
ROE measures how effectively a company uses the shareholders’ equity to generate profits. It shows the returns or profits that shareholders can get on their investments. The formula to calculate return on equity (ROE) is,
ROE = Net Income / Shareholder’s Equity * 100
A higher ROE indicates shareholders that the company is using their funds efficiently to generate higher profits. This is an important measure or yardstick while comparing companies in the same industry and of similar parameters and the ability of the management to use the resources efficiently.
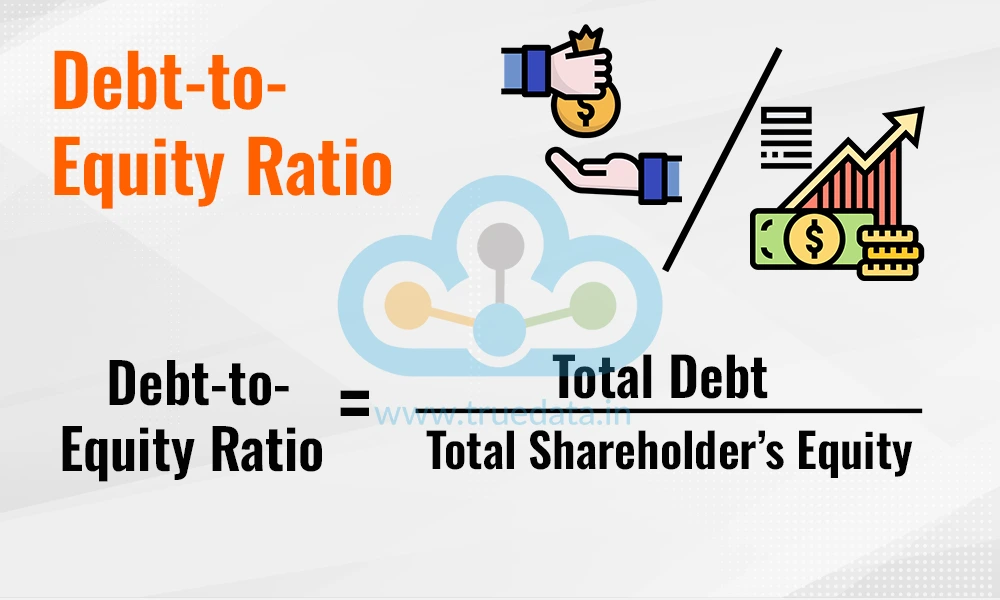
This ratio compares the company’s total debt to shareholder’s equity reflecting the dependence of the company on internal and external funds. This ratio is also used to assess the financial leverage of the company thereby allowing investors to assess the ultimate financial stability of the company. The formula to calculate the same is,
Debt to Equity Ratio = Total Debt / Shareholder’s Equity
A lower debt-to-equity ratio indicates less reliance on debt, which is a sign of financial stability while a higher ratio indicates a higher risk due to heavy borrowing. Stakeholders can use this ratio to assess the company’s long-term solvency and financial risk.
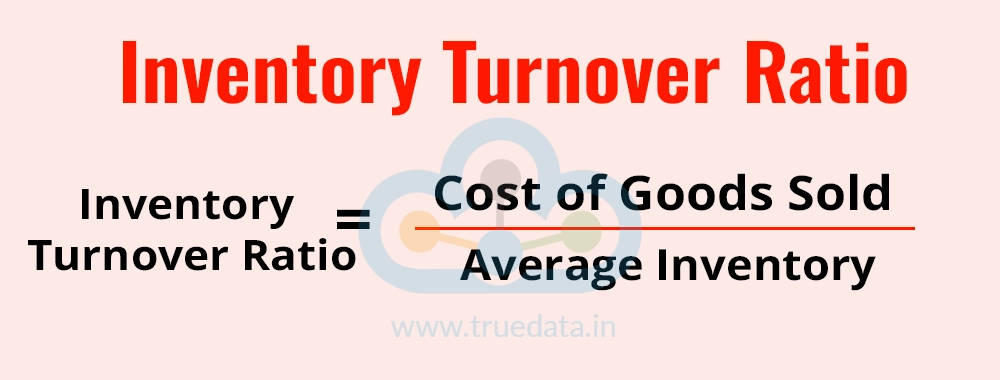
This is an important ratio to measure the efficiency of the company in managing its resources. This ratio measures how efficiently a company manages its inventory by showing how many times inventory is sold and replaced during a period. The formula to calculate this ratio is,
Inventory Turnover Ratio = Cost of Goods Sold / Average Inventory
A higher inventory turnover ratio indicates that the company is efficiently managing its inventory and generating revenues. On the other hand, a lower ratio could indicate slow-moving or excess inventory which results in tying up capital unnecessarily and a reflection on operational efficiency.
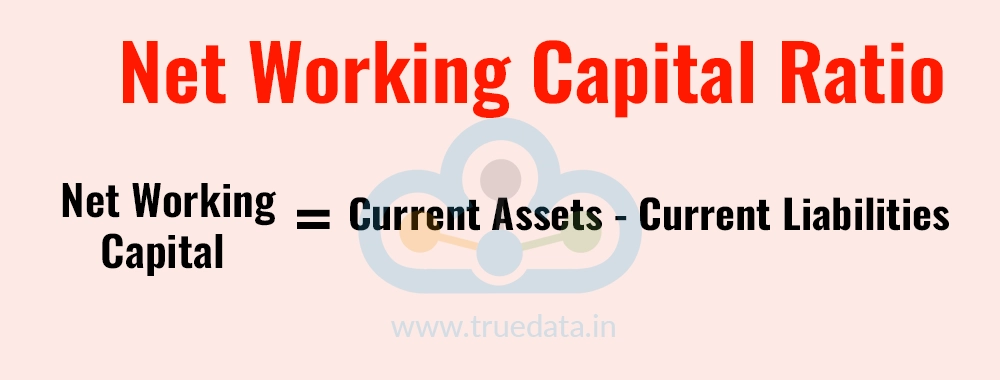
Net working capital shows the difference between the current assets and current liabilities which reflects the the company’s ability to cover the short-term obligations or the day-to-day working of the organisation. The formula to calculate the net working capital is,
Net Working Capital = Current Assets - Current Liabilities
A positive working capital indicates good liquidity, while a negative NWC may signal financial trouble. This ratio can help the stakeholders assess whether the company can fund its operations and growth in the short term thereby providing an insight into the company’s operational efficiency.
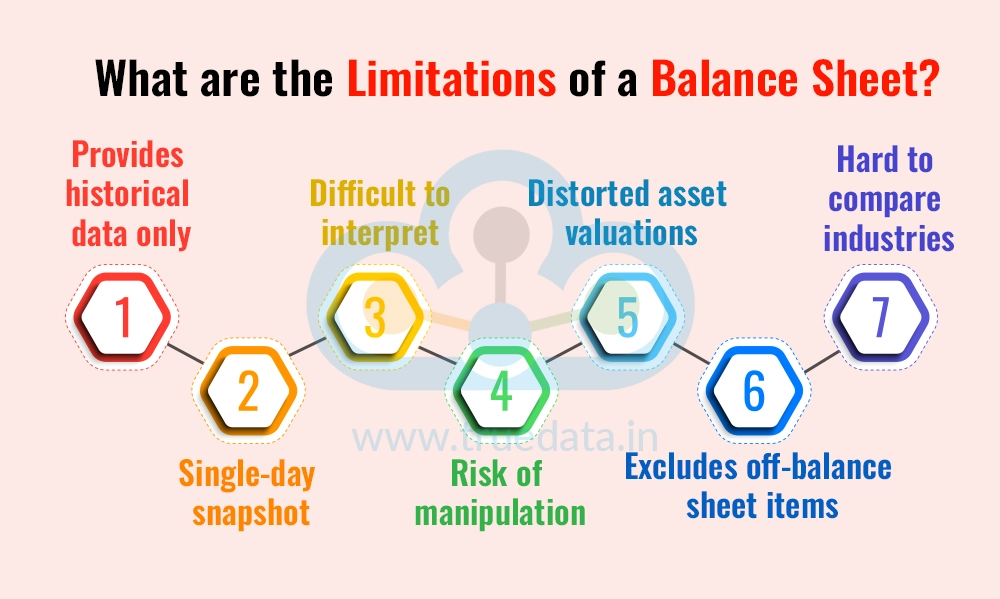
The balance sheet is an integral part of the financial statements. However, they do have their own set of limitations and cannot provide a complete picture of the company’s financial position. Some of the top limitations of using the balance sheet on a standalone basis are,
The balance sheet provides historical data and does not represent the current or future financial position of the company.
It shows a snapshot or a single-day position without any insight into key trends or changes.
Challenging for interpretation, especially, for investors with limited financial knowledge.
Risk of manipulation or window-dressing.
Valuation of assets at historical costs rather than current valuation which can provide a distorted view of the financial position of the company.
Off-balance sheet items like contingent liabilities, operating leases, etc. are not induced in the balance sheet thereby understating the actual or true risks of the company.
It is difficult to compare companies belonging to different industries by using the balance sheet alone.
Balance sheets are a vital financial statement providing a snapshot of the company’s financial health in detailing the assets, liabilities and equity of the company. It can help investors and stakeholders get insights into the operational, financial and liquidity efficiency of the company. However, it is also important to review the financial statements in their entirety to get a true and fair assessment of the company’s fundamentals and make informed decisions.
This is the first part of our series on analysing financial statements. Let us know if you need more information on this topic and watch this space for similar analysis of other financial statements of a company.
Till then Happy Reading!
Read More: Best Financial Books to Read for Beginners in Stock Market
Did you know more than 5000 companies are listed on theBSE and about 2000 on the...

If you are a shareholder of a company, you would have seen its annual reports co...
Introduction Real Time Data from NSE, BSE & MCX is distributed to various d...