
Candlestick patterns are the cornerstone of technical analysis enabling traders to understand the price movements. These patterns help traders determine suitable entry and exit points to have a successful trading portfolio banking on profitable opportunities while minimising losses. We have discussed many candlestick patterns in our previous blogs, this blog is about another important candlestick pattern, i.e., the pinbar candlestick pattern. Have you used it for trading? Check out this blog to learn more about this pattern and how to trade using the same.

The Pinbar candlestick pattern is a single candlestick pattern that is a key reversal pattern in technical analysis. This pattern is characterised by a small body and a long wick which indicates a sharp rejection of price levels. The long wick suggests that the market participants attempted to push the price in one direction but were not successful in sustaining it and the price ultimately closed near its opening price.
Pinbar candlestick patterns can be bullish or bearish reversal patterns depending on when they appear on the prevailing trend. These patterns are classic patterns used by price action traders across the globe to understand trend reversals and identify suitable trading opportunities.

The pinbar candlestick pattern is an easy-to-recognise and easy-to-trade pattern. It has a classic small body with a long wick at the top or the bottom. The key idea behind the Pinbar is that the price moved strongly in one direction but was quickly rejected by the market, forcing it to close near where it opened. This shows that buyers or sellers have taken control, making it a strong reversal signal.
Key Features of a Pinbar Candlestick
Small Body - The body of the candle (the area between the open and close price) is small compared to the entire candlestick. This means that the price did not move much between opening and closing.
Long Wick (Shadow) on One Side - The most important part of a Pinbar is its long wick (also called a shadow or tail). This wick should be at least twice the size of the body.
Short or No Wick on the Other Side - The other side of the candlestick should have little to no wick.
Appears at Key Levels - A Pinbar is most effective when it forms near important support and resistance levels, trendlines, Fibonacci retracement zones, or moving averages.
Types of Pinbar Candlestick Pattern
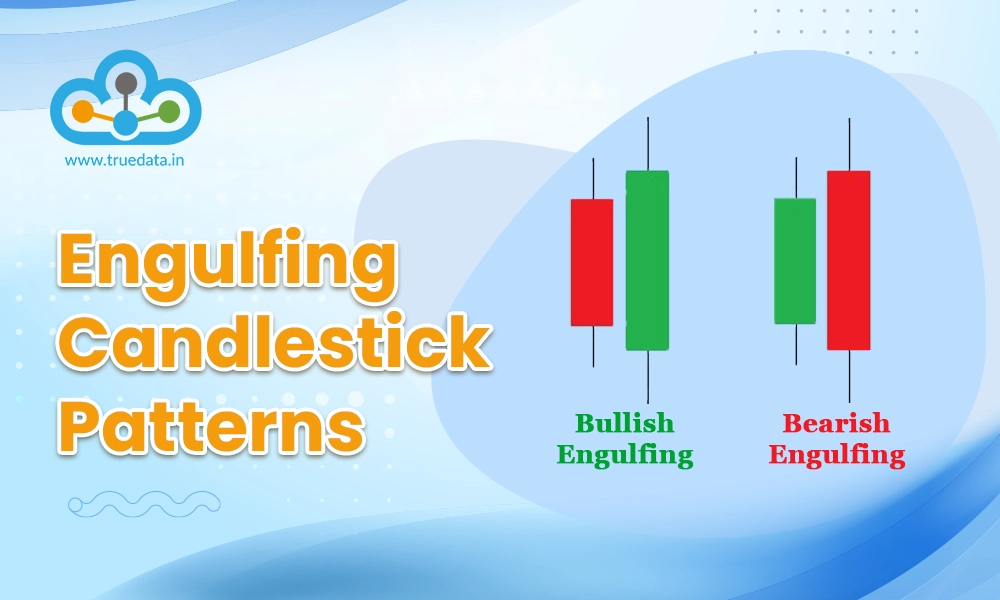
Bullish Pinbar (Buy Signal) - This candlestick appears after a downtrend and has a long lower wick. This implies that the price went down but buyers pushed it back up before closing suggesting a potential upward reversal.
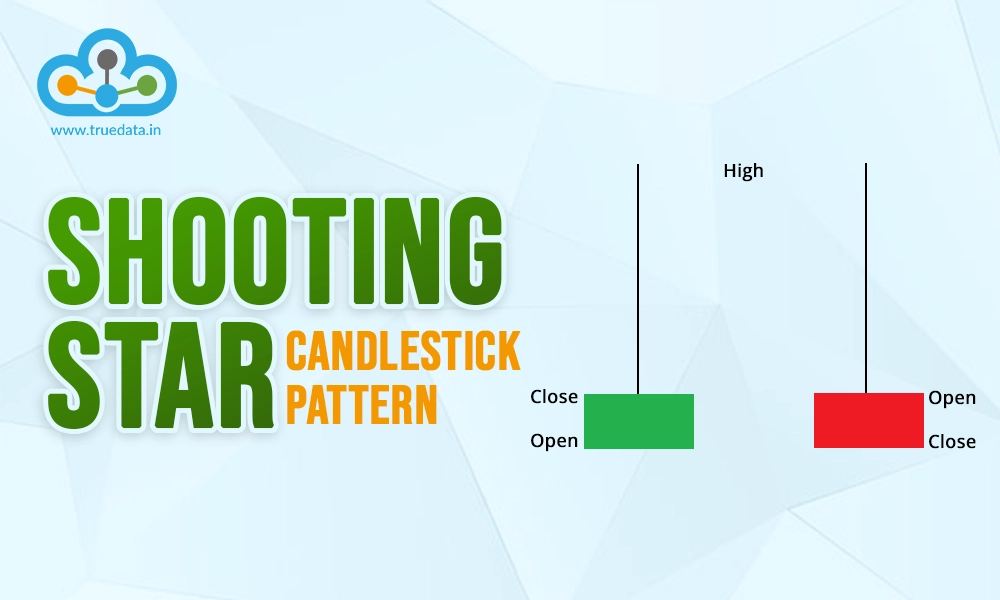
Bearish Pinbar (Sell Signal) - This candlestick appears after an uptrend and has a long upper wick. This implies that the price went up but sellers forced it back down before closing suggesting a potential downward reversal.
The purpose of candlestick patterns is to make sense of the price patterns leading the trend identification and making informed decisions. The use of a pinbar candlestick pattern is to identify the bullish or bearish reversals to make suitable exits or entries into a trade and capitalise on profitable opportunities. Here is a brief analysis of how to trade using the two distinct types of pinbar candlestick patterns in different markets.

A bullish pinbar is formed when the price drops sharply but the buyers take control and push it back up indicating strong buying pressure and potential upward reversal. The steps to trade using the bullish pinbar candlestick pattern are,
Identify the Pattern - A Bullish Pinbar appears during a downtrend and has a small body, a long lower wick, and a very short upper wick. The long lower wick shows that the price fell but quickly recovered, indicating that sellers were unable to push prices lower.
Confirm the Trend - Traders should confirm that the market is indeed in a downtrend before entering a trade when the Pinbar appears. Additional confirmation can be done using indicators like RSI (Relative Strength Index), moving averages, Fibonacci retracement levels, or support zones. If the Pinbar forms near a strong support level, it becomes an even stronger buying signal.
Enter the Trade - Traders should place a buy order above the high of the Bullish Pinbar. This implies waiting for the price to move higher than the Pinbar before entering the trade. This step ensures that buyers are actually pushing the price up after the pattern appears.
Set Stop Loss - A stop-loss order should be placed below the low of the Bullish Pinbar. This protects traders from unnecessary losses if the trade goes in the opposite direction. The risk is minimised by setting a stop loss when the market does not reverse as expected.
Take Profit - Finally, traders should set a profit target to exit the trade successfully based on previous resistance levels or a risk-reward ratio. A good risk-reward ratio is 1:2 or higher, implying that for every Re. 1 risked, the trader aims to gain Rs. 2 or more.

Identify the Pattern - A Bearish Pinbar forms during an uptrend and has a small body, a long upper wick, and a very short lower wick. The long upper wick shows that the price tried to move up but was rejected, indicating that buyers lost control and sellers might push prices lower. This signals a potential price reversal to the downside.
Confirm the Trend - Traders should also confirm that the market was in an uptrend before the Bearish Pinbar appeared. Additional confirmation can be obtained using resistance levels, RSI (if it is in the overbought zone above 70), moving averages, or Fibonacci retracements. If the Bearish Pinbar appears at a strong resistance level, it is a stronger signal for selling.
Enter the Trade - Traders should place a sell order below the low of the Bearish Pinbar. This ensures that the price is actually moving downward after the Pinbar appears, confirming that sellers have taken control.
Set Stop Loss - A stop-loss order should be placed above the high of the Bearish Pinbar as part of risk management. This limits the loss if the price unexpectedly moves higher instead of reversing downward.
Take Profit - Finally, traders should set a profit target based on previous support levels or a risk-reward ratio. A good strategy is to aim for at least 1.5 to 2 times the risk taken, ensuring that profits outweigh potential losses.

The pros and cons of the pinbar candlestick pattern are a step further in understanding this pattern better thereby ensuring effective trading. Here are the pros and cons of using the pinbar candlestick patterns.
Easy to identify and interpret.
Indicates potentially strong trend reversals.
Applicable in multiple markets (commodities, equities, forex) and multiple time frames (intraday, swing and positional trading).
Less reliable in choppy or sideways markets or news-driven markets.
Requires confirmation from other indicators.
Does not guarantee success in trades and requires proper risk management.

The pinbar candlestick pattern is quite similar in appearance to another popular candlestick pattern, i.e., the hammer candlestick pattern. However, there is a significant difference between the two in how they appear and what they signal. The meaning of each pattern and the key difference between the two are explained below.
A Pinbar (short for ‘Pinocchio Bar’) has a long wick and a small body, indicating a strong rejection of price in one direction. It can be either a bullish (long lower wick, small upper body) or a bearish (long upper wick, small lower body) pattern. As a thumb rule, the longer the wick on the pattern, the stronger the rejection of that price level. Pinbars can thus appear in both uptrends and downtrends, signalling potential reversals. Traders can use Pinbars in combination with support and resistance levels to confirm possible entry points.
A Hammer candlestick, on the other hand, is a specific type of Pinbar that appears at the bottom of a downtrend and signals a potential reversal to the upside. It has a small body at the top, little or no upper wick, and a long lower wick, resembling a hammer. The long wick shows that sellers pushed the price down significantly, but buyers regained control and closed near the opening price. A Hammer is a bullish reversal pattern and is stronger when it forms near support levels or key price zones. Unlike the pinbar, which can signal both bullish and bearish moves, the Hammer candlestick pattern is only considered a bullish signal.
The pinbar candlestick pattern is a powerful tool in technical analysis to identify potential market reversals in diverse markets and timeframes. This pattern allows traders to trade in both bullish and bearish markets by recognising trend reversals and confirming the same using other technical analysis tools and indicators. However, traders should also be aware of the risks of using the pinbar pattern and implement effective risk management strategies to avoid losses in the face of sudden market turns or failed reversals.
This pattern is another addition to the series on candlestick patterns and how to use them effectively. Let us know your thoughts on this pattern in the comments or if you have any queries regarding the same.
Till then Happy Reading!
Marisha Bhatt is a financial content writer @TrueData.
She writes with the sole aim of simplifying complex financial concepts and jargon while attempting to clarify technical and fundamental analysis concepts of the stock markets. The ultimate goal is to spread vital knowledge and benefit the maximum audience. Her Chartered Accountant background acts as the knowledge base to help clarify crucial concepts and create a sound investment portfolio.
Candlestick patterns are among the most basic and common tools traders use to cr...
Stock markets have been under a lot of pressure in the past week and investors ...
The world oftechnical analysis is filled with many tools like candlestick patter...