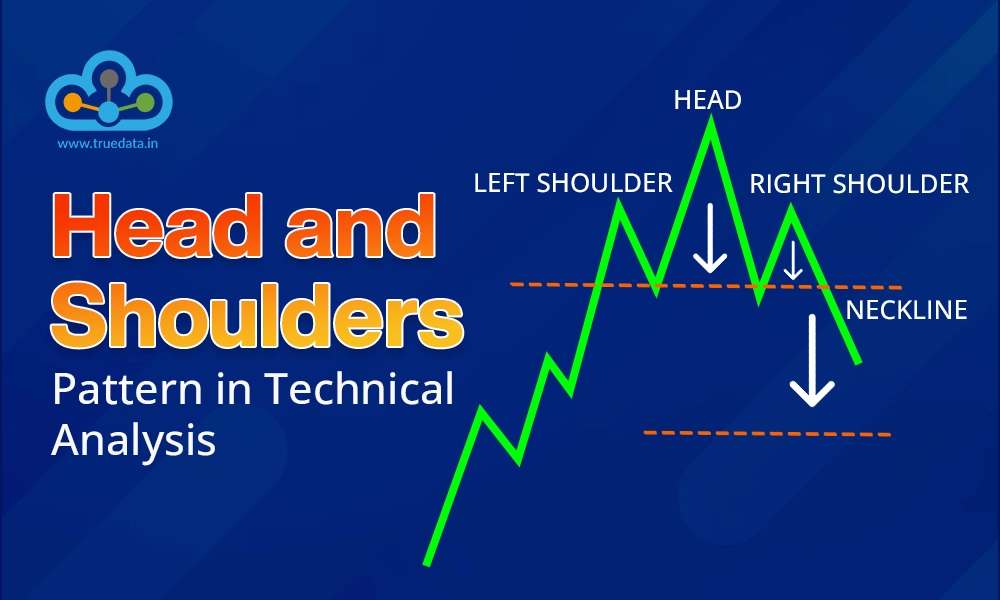
Technical analysis is the basis of stock trading and finding suitable entry and exit opportunities in the market for the target stocks or assets. Traders use various technical analysis tools like candlestick patterns, chart patterns and more to meet this purpose. Head and shoulder patterns are among the common patterns used by traders across the globe to get market insights and make informed decisions. Here is all you need to know about the head and shoulders pattern in technical analysis to shape a robust investment portfolio.
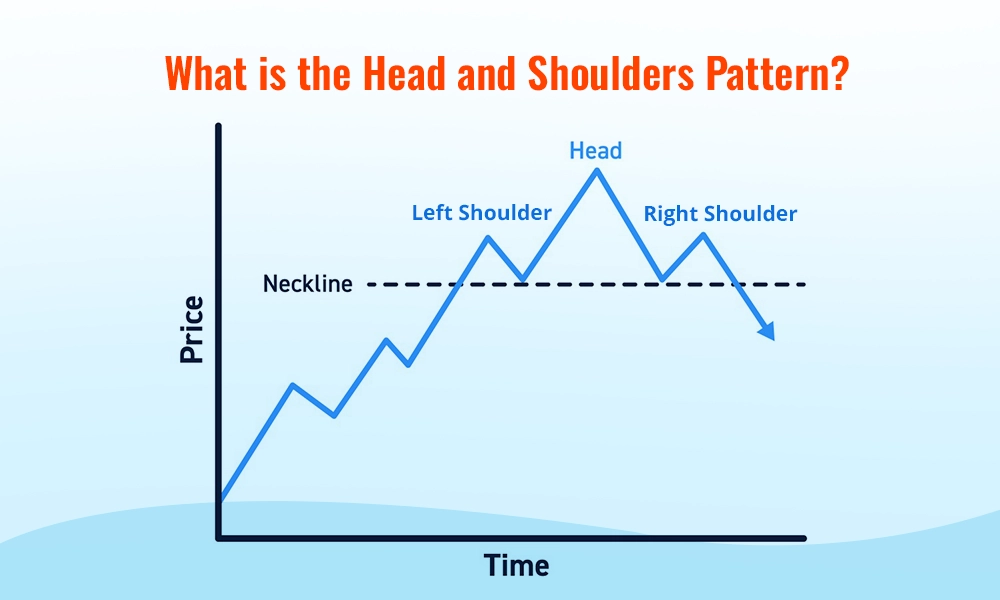
The Head and Shoulders pattern is a chart formation that often signals a reversal in the trend of a financial asset like stocks, commodities, or currencies. Traders use this pattern to spot when a market is about to shift from an upward trend to a downward trend (or vice versa), making it an essential tool for both beginners and experienced investors. This pattern has three peaks with the centre peak shaped like a ‘head’ supported by the two ‘shoulders’ or smaller peaks on either side which gives the pattern its name.
There are two main types of Head and Shoulder patterns,
 Pattern.webp)
This version of the pattern occurs in an uptrend and signals a reversal, implying that the price is likely to start falling. It begins with a peak (shoulder), followed by a higher peak (head), and then another lower peak (shoulder). After these three peaks, the price usually breaks below the ‘neckline’ (a line that connects the two low points between the peaks) indicating that a downward trend may follow.
 Pattern.webp)
This type forms during a downtrend and suggests a reversal to the upside, indicating that the price may rise. It appears as a low point (shoulder), followed by an even lower point (head), and then another higher low (shoulder). Once the price breaks above the neckline, traders expect the asset's price to increase.
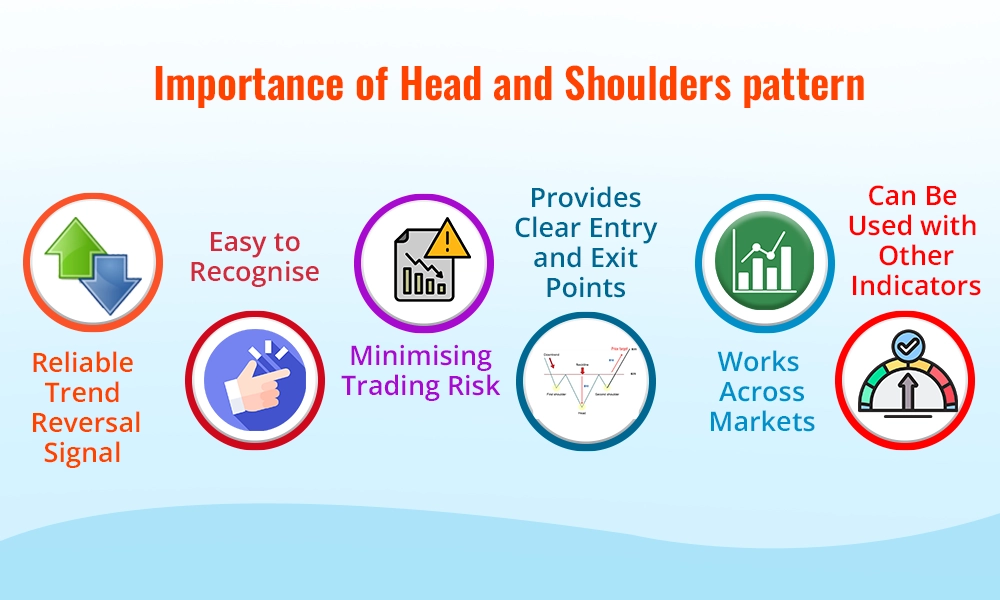
The importance of the head and shoulders pattern and the reasons that make it a popular chart pattern used by traders across the globe are explained hereunder.
Reliable Trend Reversal Signal - This pattern helps traders identify reversals from an upward trend into a downward trend and vice versa, allowing them to make better decisions about when to sell or short an asset.
Easy to Recognise - The pattern is relatively simple to spot on price chart patterns, even for beginners in trading. Its distinctive shape makes it a useful tool for predicting market movements without needing complex analysis.
Minimising Trading Risk - By recognising this pattern early, traders can avoid holding onto positions during a potential reversal, which can minimise losses and reduce risk.
Provides Clear Entry and Exit Points - The break of the neckline provides a clear signal for traders to enter or exit a trade, helping them time their trades more effectively.
Works Across Markets - Traders can apply this pattern to different markets, such as stocks, forex, and commodity markets, making it versatile and widely applicable.
Can Be Used with Other Indicators - The pattern can be combined with other technical indicators, like volume or moving averages, to confirm signals and improve trading accuracy.
One of the classic features of the head and shoulders pattern is its ease of identification. Here are the steps to identify the same correctly and its interpretation.
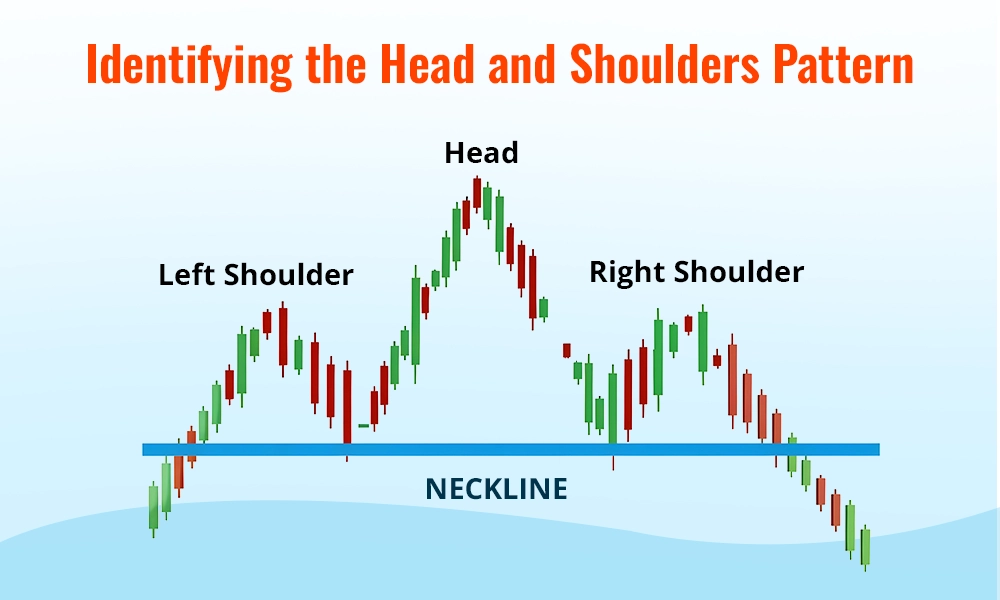
Left Shoulder - The pattern starts with a price rise, which peaks and then declines slightly. This first peak forms the ‘left shoulder’ or the first peak. It represents a temporary high before the price pulls back.
Head - After the left shoulder, the price rises again, but this time it reaches a higher peak, which is the ‘head’ of the pattern, the second peak. The head is the highest point of the formation and signals the potential end of the upward trend.
Right Shoulder - After forming the head, the price declines again but rises for a third time to form the ‘right shoulder’, the third peak. This peak is lower than the head and is usually similar to the height of the left shoulder.
Neckline - The neckline is the line drawn by connecting the two lowest points between the left shoulder, head, and right shoulder. It serves as the critical level, and when the price breaks below (or above in an inverse pattern), it confirms the pattern.
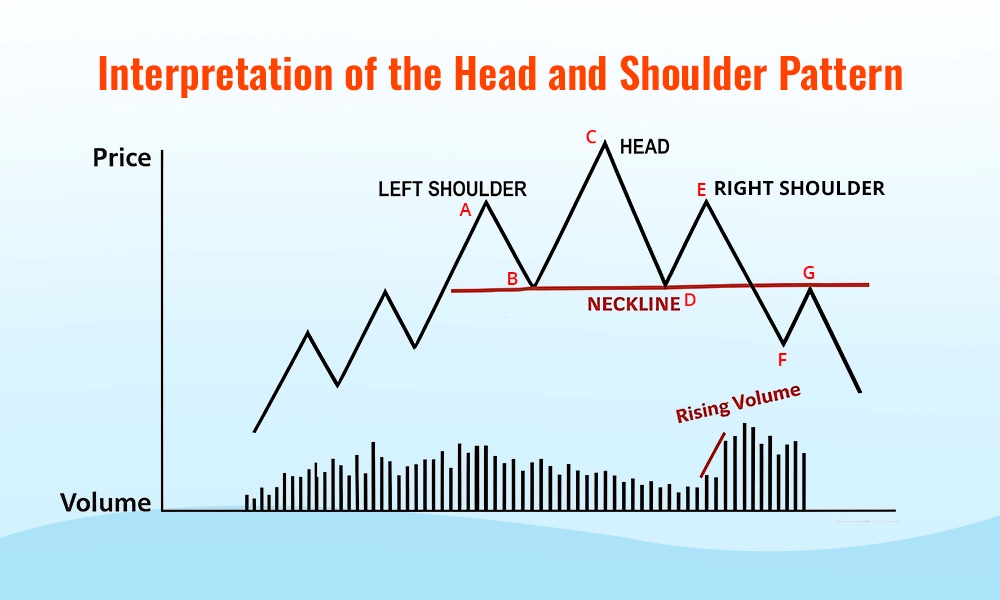
Breakout and Confirmation - Once the pattern is identified, the key signal is when the price breaks below the neckline (in a top pattern) or above it (in an inverse pattern). This breakout signal usually confirms the reversal, and traders may take this as a signal to sell (in a top pattern) or buy (in an inverse pattern).
Trend Reversal Signal - The Head and Shoulder pattern is mainly interpreted as a reversal signal. In an uptrend, it shows that buying pressure is weakening, and selling pressure is increasing, leading to a potential downtrend. In a downtrend, an inverse pattern signals that selling pressure is decreasing, and buying demand is returning, potentially pushing prices higher.
Volume Confirmation - Traders should also watch the trading volume for analysis and better accuracy. In a Head and Shoulders pattern, volume usually decreases as the price forms the head and the right shoulder. The volume typically increases when the price breaks the neckline, giving extra confirmation of the reversal.
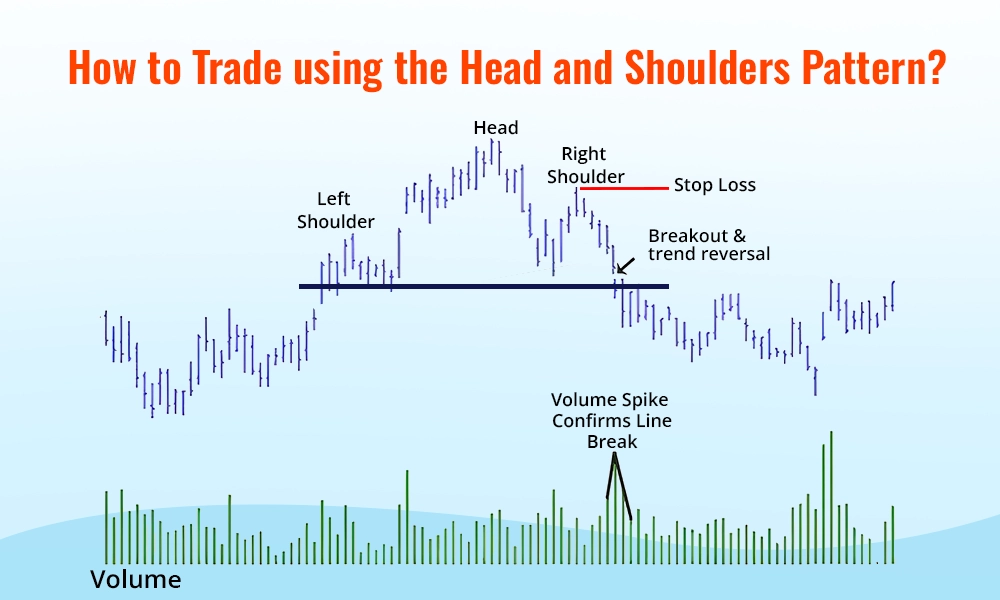
The steps to trade using the Head and Shoulder pattern are explained below.
Spot the left shoulder, head, and right shoulder, along with the neckline, to confirm the formation.
For a regular pattern, wait for the price to break below the neckline before entering a sell trade. For an inverse pattern, wait for the price to break above the neckline to enter a buy trade.
Enter the trade right after the price breaks the neckline with strong volume, indicating confirmation of the trend reversal.
Place a stop-loss above the right shoulder (in a top pattern) or below the right shoulder (in an inverse pattern) to minimize risk in case the breakout fails.
The target price is typically calculated by measuring the distance from the head to the neckline and projecting that distance from the breakout point.
Higher volume on the breakout increases the chances of a successful trade. Low volume may suggest a false breakout, so traders should be cautious.
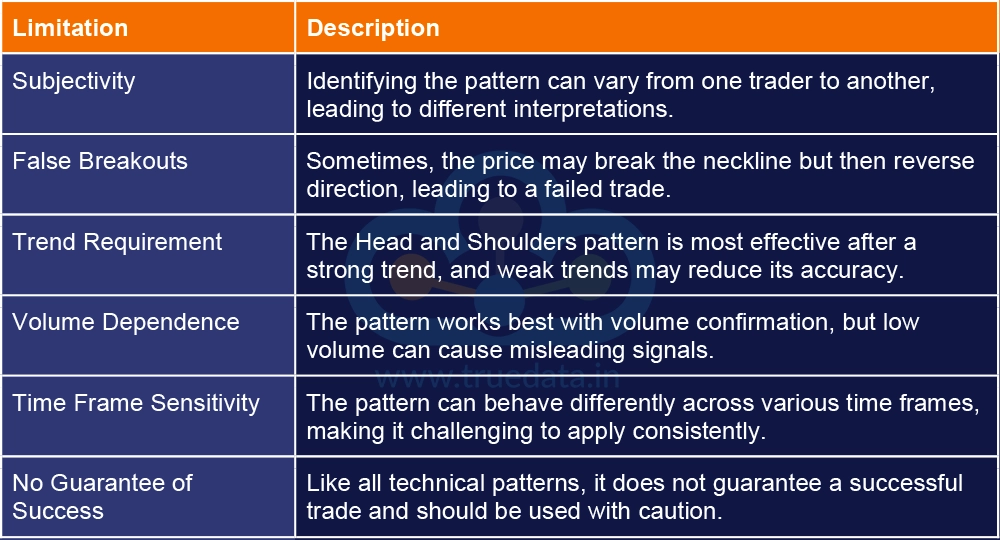
While the Head and Shoulders Pattern is quite popular, it is not short of limitations. Here is a list of the common limitations that traders should consider while using this pattern.
The Head and Shoulders pattern is a powerful and widely used tool in technical analysis, offering traders a clear signal for potential trend reversals. By identifying the pattern correctly, traders can strategically time their entries and exits in the market. However, this pattern like any other technical analysis tool should not be used in isolation to avoid false confirmations and should be complemented with other indicators for better analysis and making informed portfolio decisions.
This article talks about the Head and Shoulder Pattern in detail and helps traders understand it better to shape their trading portfolio. Let us know if you have any queries on this topic or want information on similar chart patterns.
Till Then Happy Reading!
Read More: What is the Marubozu Candlestick Pattern?
Candlestick patterns are among the most basic and common tools traders use to cr...
Stock markets have been under a lot of pressure in the past week and investors ...

The use of technical analysis for trading is vital for creating a successful tr...