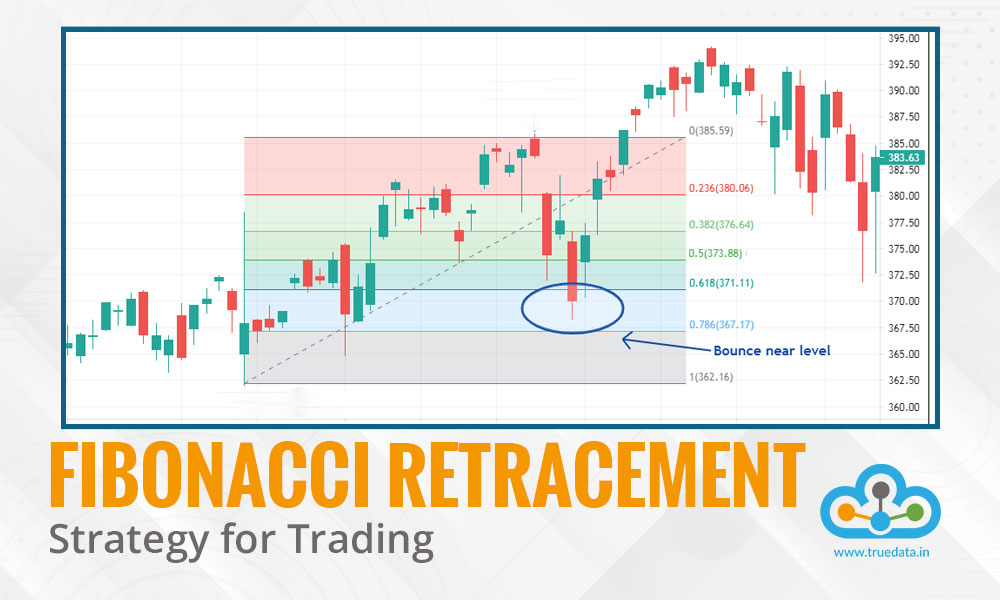
If you are a trader, then you would have definitely heard the term Fibonacci retracements somewhere in your research. While this term sounds too technical, did you know that it is not restricted to stock markets alone? Fibonacci patterns are found in many areas like art, architecture, shells, flowers, trees and so on. It is the golden ratio that envelops the earth and can also be said to be as old as our knowledge about our planet goes. So what is this Fibonacci sequence, golden ratio or Fibonacci retracements and how are they relevant in trading? Learn all these key points in this blog and refine your knowledge further.
Read More: What are the golden rules of successful trading?
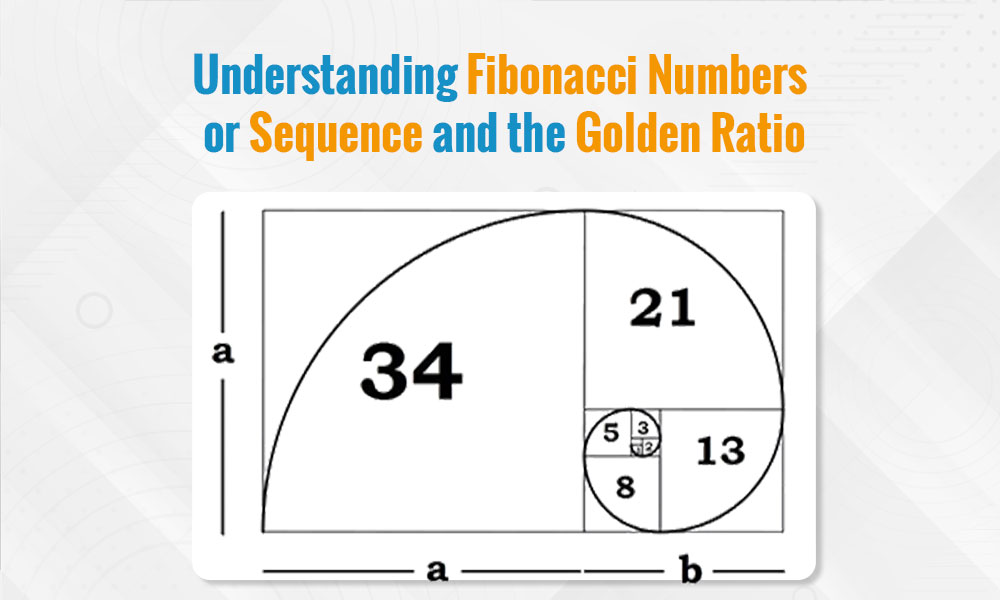
The Fibonacci sequence is a series of numbers where each number is the sum of the two preceding ones. It begins with 0 and 1, and the sequence continues infinitely. So, the sequence starts as follows: 0, 1, 1, 2, 3, 5, 8, 13, 21, 34, and so on. This sequence is named after Leonardo of Pisa, commonly known as Fibonacci, an Italian mathematician from the Middle Ages who introduced it to the Western world in his book "Liber Abaci." The sequence has remarkable properties and appears in various natural phenomena, such as the arrangement of petals in flowers, the branching of trees, and the spirals of shells. In mathematics and finance, Fibonacci numbers are used to model growth processes and describe patterns in nature and human behaviour.
The Golden Ratio, often denoted by the Greek letter phi (φ), is a mathematical constant approximately equal to 1.61803398875. It is derived from the Fibonacci sequence by taking the ratio of successive Fibonacci numbers. As you progress through the Fibonacci sequence, dividing a number by its preceding number, the ratio approaches the Golden Ratio. The Golden Ratio has fascinated mathematicians, artists, architects, and scientists for centuries due to its aesthetic appeal and prevalence in nature. It appears in the proportions of the human body, the architecture of ancient civilisations like the Egyptians and Greeks, and artworks such as the Mona Lisa and the Parthenon.
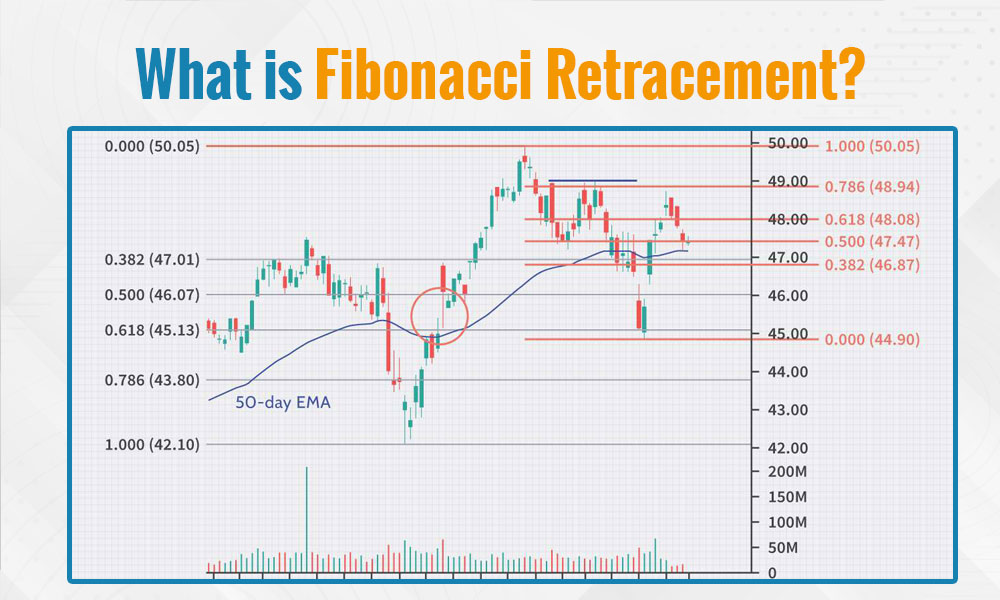
Fibonacci retracement is a technical analysis tool used by traders in India and globally to identify potential levels of support and resistance in financial markets. It is based on the Fibonacci sequence, a mathematical concept where each number is the sum of the two preceding ones. In trading, Fibonacci retracement levels are drawn on price charts to indicate areas where a financial asset may experience a reversal or consolidation after a significant price movement. The key Fibonacci retracement levels include 23.6%, 38.2%, 50%, 61.8%, and 100%, each representing a percentage of the original price movement. Traders use Fibonacci retracements to make informed decisions to shape their trading portfolio enhancing their trading strategies and risk management techniques.
.jpg)
Traders can apply Fibonacci retracement levels to stock charts to forecast potential price reversals or areas of price consolidation. The use of Fibonacci Retracements in the world of stock trading can be explained hereunder.
The first step in using Fibonacci retracements is to identify significant swing highs and lows on the price chart. A swing high occurs when the price peaks after an uptrend, while a swing low is formed when the price troughs following a downtrend. These points serve as reference levels for drawing Fibonacci retracement lines. After identifying swing highs and lows, traders use charting software or tools to draw Fibonacci retracement levels. The tool is applied from the swing low to the swing high in an uptrend and vice versa in a downtrend. Common retracement levels include 23.6%, 38.2%, 50%, 61.8%, and 100%.
23.6% - This level indicates a shallow retracement and is considered a weak level of support or resistance.
38.2% - This level suggests a moderate retracement and is often considered a more significant level of support or resistance.
50% - While not a Fibonacci number, the 50% level is commonly used by traders as a potential reversal or continuation area.
61.8% - Also known as the "golden ratio," this level is considered one of the strongest Fibonacci retracement levels.
100% - This level represents a complete retracement back to the original price level before the trend began.
Traders often utilise Fibonacci retracement levels to identify opportune entry points in their trading strategies. During an uptrend, traders may observe the price retracing to key Fibonacci support levels, such as the 38.2% or 50% retracement levels. These levels often coincide with areas of previous support or resistance, providing traders with potential buying opportunities. Similarly, in a downtrend, traders may consider shorting positions near Fibonacci resistance levels, anticipating the continuation of the downward trend. By entering trades near Fibonacci retracement levels, traders aim to capitalise on potential price reversals or continuations based on historical price behaviour and market psychology.
Fibonacci retracement levels also serve as valuable guides for determining exit points in trading positions. After entering a trade, traders may use Fibonacci levels to set profit targets or identify areas where they anticipate price reversals. For instance, if a trader enters a long position near a Fibonacci support level, they may set a profit target near a higher Fibonacci retracement level, such as the 61.8% level. Conversely, if shorting a position near a Fibonacci resistance level, traders may set profit targets near lower Fibonacci retracement levels. This approach allows traders to lock in profits and exit trades strategically, based on the anticipated behaviour of price retracements.
Effective risk management is paramount in trading, and Fibonacci retracement levels can assist traders in placing stop-loss orders to mitigate potential losses. Traders often position stop-loss orders just beyond key Fibonacci retracement levels, slightly outside the range where price retracements are expected to occur. By doing so, traders aim to give their positions enough room to withstand normal market fluctuations while preventing excessive losses in case the price moves against their expectations. This disciplined approach to stop-loss placement helps traders preserve capital and manage risk effectively in their trading endeavours.
In addition to serving as entry, exit, and stop-loss points, Fibonacci retracement levels act as a confirmation tool when used in conjunction with other technical indicators. Traders often combine Fibonacci retracements with indicators such as moving averages, oscillators, or trendlines to validate their trading signals. For example, if a Fibonacci retracement level coincides with a significant moving average or a trendline, it strengthens the trader's conviction in the potential price reversal or continuation at that level. By confirming trading signals with multiple indicators, traders increase the probability of successful trades and reduce the likelihood of false signals, enhancing the overall effectiveness of their trading strategies.
Fibonacci Retracements is a widely popular concept in stock markets. However, there are a few limitations to using the Fibonacci Retracements that traders need to be aware of. Here is a brief explanation of the same.
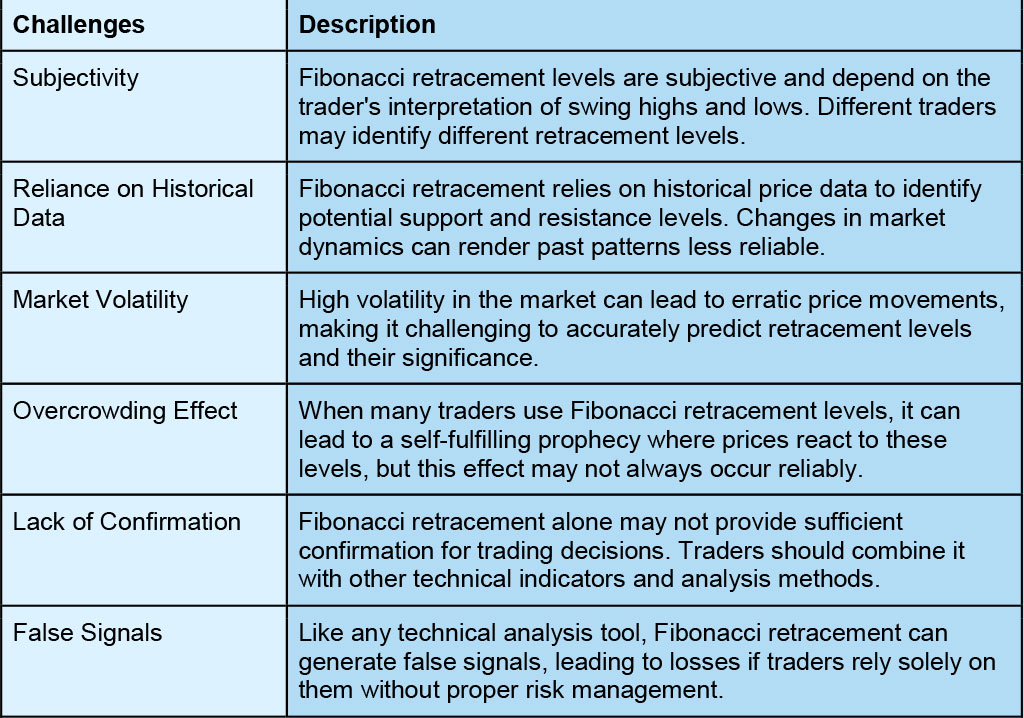
Fibonacci retracement is a widely used technical analysis tool among traders in India due to its effectiveness in identifying potential levels of support and resistance. By understanding this concept in detail, traders can make more informed trading decisions and also use it for better risk management. However, it is crucial to remember that Fibonacci retracement is just one tool in a trader's arsenal and should be used in conjunction with other analysis techniques and risk management practices.
We hope this article was able to explain the concept of Fibonacci Retracements and its use in trading in a simplified manner. Let us know if you have any queries relating to this topic or need any further information on the same.
Till then Happy Reading!

The world of trading is constantly evolving with the use of advanced technology ...

Fundamental analysis and technical analysis of securities are the basis used for...
Stock trading is fast becoming one of the leading career choices of young profes...