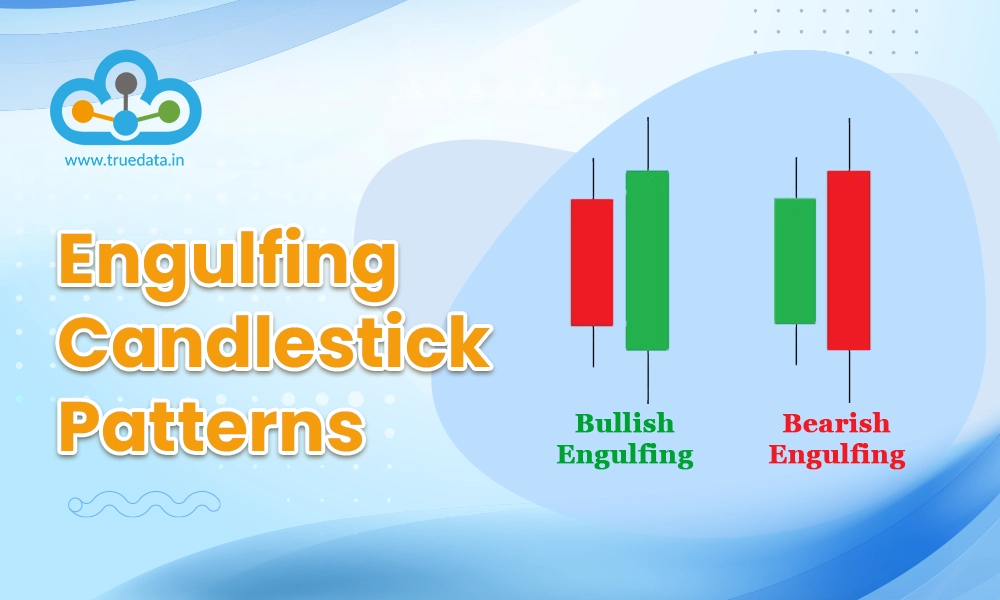
Candlestick patterns are among the most basic and common tools traders use to create successful trading portfolios. While many types of candlestick patterns are commonly used to make informed trading decisions, engulfing candlestick patterns often stand out. Curious to know more about them? Check out this blog to learn about the engulfing candlestick patterns and how to use them to create a successful trading portfolio.
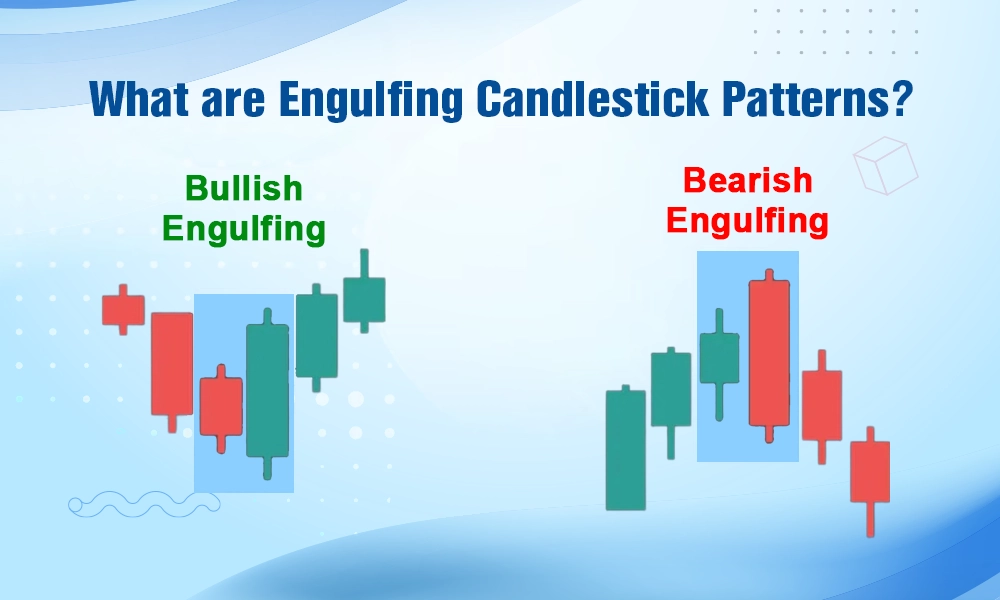
Engulfing Candlestick Patterns are a type of chart pattern used in technical analysis to predict market trends. They occur when a larger candlestick completely covers or "engulfs" the previous smaller one, signalling a potential reversal in price direction. There are two types of engulfing candlestick patterns, i.e., bullish engulfing pattern and bearish engulfing pattern. These patterns are a useful tool in determining entry and exit points for trade or understanding the market behaviour to make informed portfolio decisions.
Engulfing candlestick patterns are key indicators in technical analysis, used by traders to predict price reversals. The two main types of engulfing patterns are Bullish Engulfing and Bearish Engulfing. These patterns are explained in detail below.
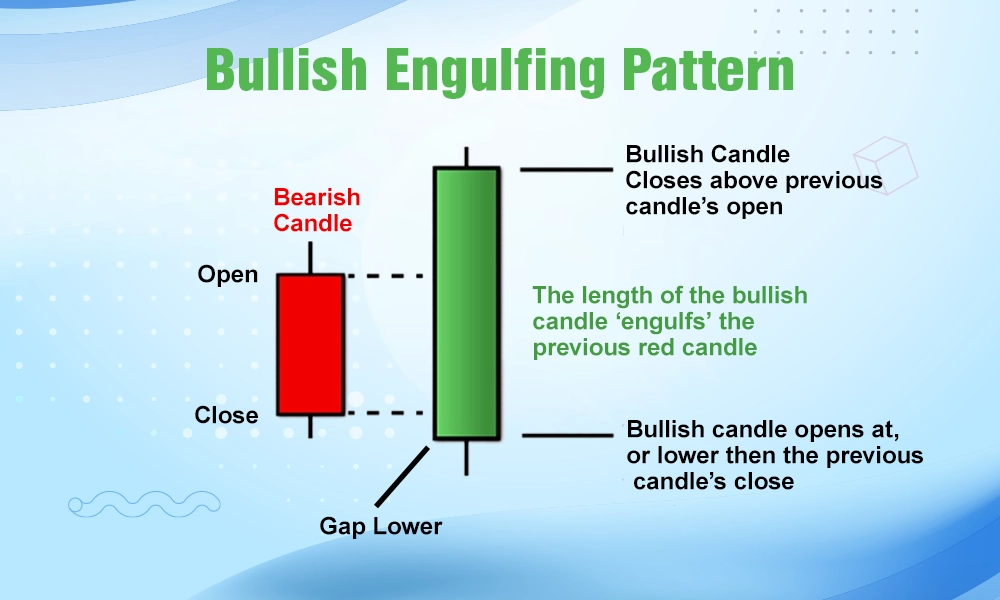
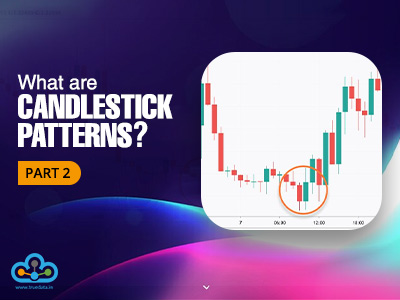
A Bullish Engulfing Pattern suggests that the market might move upwards, signalling a potential buying opportunity. This pattern usually forms after a downward trend or at the bottom of a consolidation phase.
The pattern consists of two candles. The first is a small red (bearish) candle, showing that sellers were in control.
The second candle is a large green (bullish) candle, which completely covers or ‘engulfs’ the previous red candle, showing that buyers have taken over.
The appearance of this pattern suggests a strong buying pressure, and the price may start rising.
A bullish engulfing pattern is considered a sign of reversal in a downtrend and is a signal to consider buying. For example, if a stock has been falling for several days, this pattern could indicate that the price is about to go up. Traders can use this pattern to identify the right time to enter the market by buying stocks, commodities, or currencies.
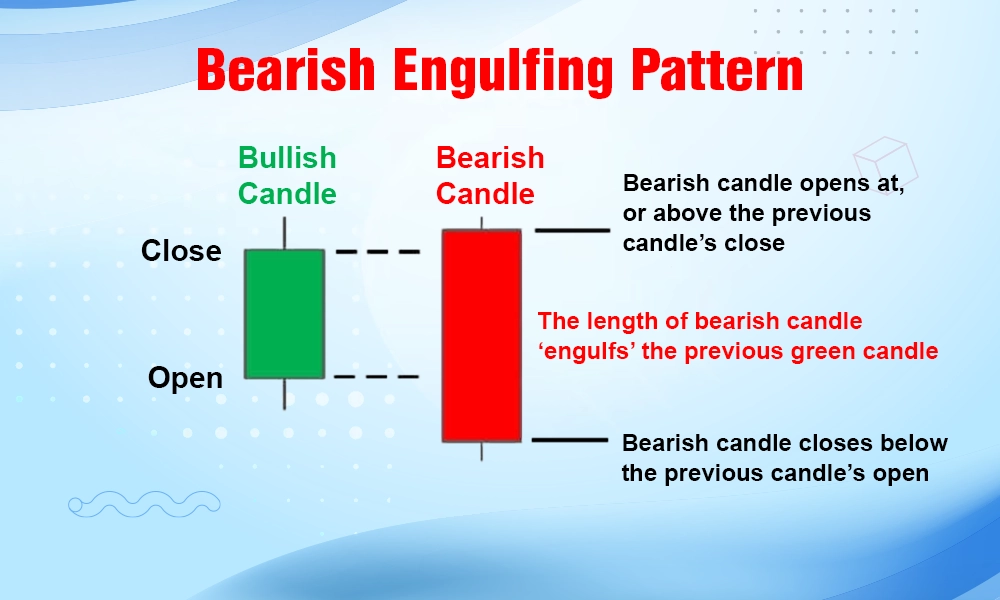
A Bearish Engulfing Pattern suggests that the market might move downwards, signalling a potential selling opportunity. This pattern typically forms after an upward trend or at the top of a consolidation phase.
The first candle is a small green (bullish) candle, showing that buyers were in control.
The second candle is a large red (bearish) candle, which completely engulfs the previous green candle, showing that sellers have taken over.
When this pattern appears, it indicates strong selling pressure, and the price may start to fall.
A bearish engulfing pattern signals a possible reversal in an uptrend and a sign to consider selling. If a stock has been rising for several days, this pattern could mean the price may start to drop. Traders can use this as a signal to sell their positions or short-sell in the market to profit from the expected downward movement.

After understanding the basics of bullish and bearish engulfing patterns, let us now look at how to use them to trade effectively.
Identify the Pattern - Look for Bullish or Bearish Engulfing patterns after a clear trend (uptrend or downtrend).
Confirm the Trend - Use other indicators like moving averages, RSI, or volume to confirm the trend reversal signalled by the engulfing pattern.
Bullish Engulfing (Buy Signal) - If you see a Bullish Engulfing pattern after a downtrend, consider buying, as it suggests the price may start rising.
Bearish Engulfing (Sell Signal) - If you spot a Bearish Engulfing pattern after an uptrend, consider selling or shorting, as it indicates the price may fall.
Set Stop-Loss - Always set a stop-loss below the engulfing pattern to limit risk in case the market doesn’t move as expected.
Monitor Market Conditions - Keep an eye on overall market trends and news that might affect prices to ensure the trade remains favourable.
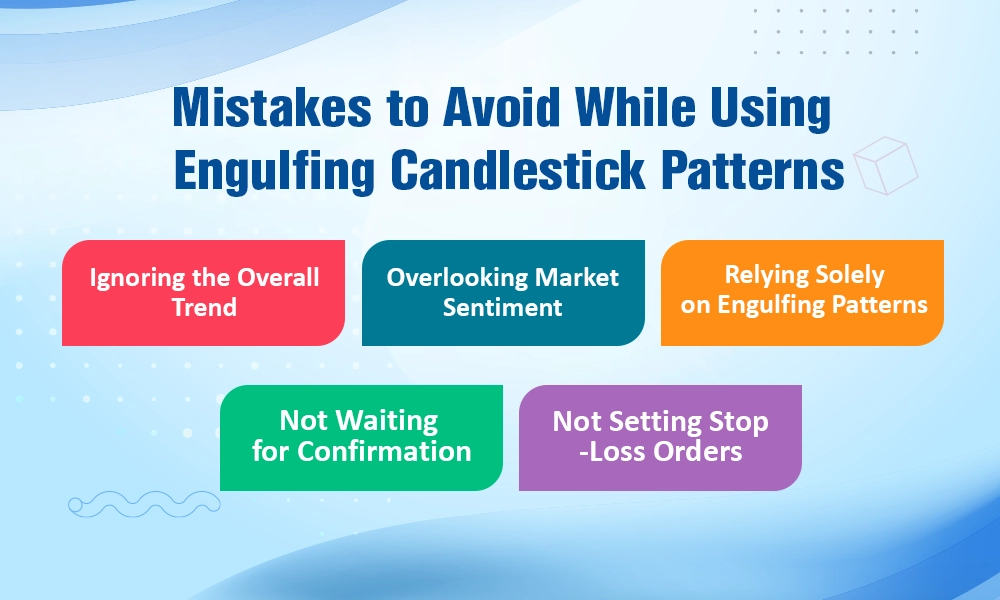
Engulfing candlestick patterns are considered to be among the basic candlestick patterns that can help traders enhance their trading strategies. However, there are a few common pitfalls that need to be avoided while using them. Here are some of the common mistakes that can affect the trading portfolio while using the bullish and bearish engulfing candlestick patterns.
One common mistake is focusing only on the engulfing pattern without considering the broader market trend. Engulfing patterns work best when they appear at the end of a trend. If the market is already moving sideways or lacks direction, the pattern may give false signals. Always confirm the overall trend before acting on these patterns.
Traders may also ignore the broader market sentiment or news that can affect stock prices. Even if an engulfing pattern appears, external factors like economic reports or political events could drive the market in an unexpected direction. Always stay updated with news and consider how it may impact your trades.
Relying only on engulfing candlestick patterns without considering other technical indicators can lead to bad decisions. Engulfing patterns are more reliable when used with other tools like support and resistance levels, moving averages, or volume analysis. Combining multiple indicators increases the chances of success.
Another mistake is acting too quickly without waiting for confirmation of the pattern. Traders often jump into trades as soon as they spot an engulfing pattern, but it’s better to wait for the next candle to confirm the price direction. Without confirmation, there’s a risk of entering a trade based on a false signal.
Lastly, not using stop-loss orders can be a costly mistake. Even with an engulfing pattern, the market can move against you. Setting a stop-loss limits potential losses and protects your investment if the trade goes wrong. This is a key risk management tool for all traders, especially beginners.
The final step in understanding the engulfing candlestick patterns is focusing on the pros and cons of using these patterns to ensure a robust trading portfolio. Here is a brief snapshot of the same.
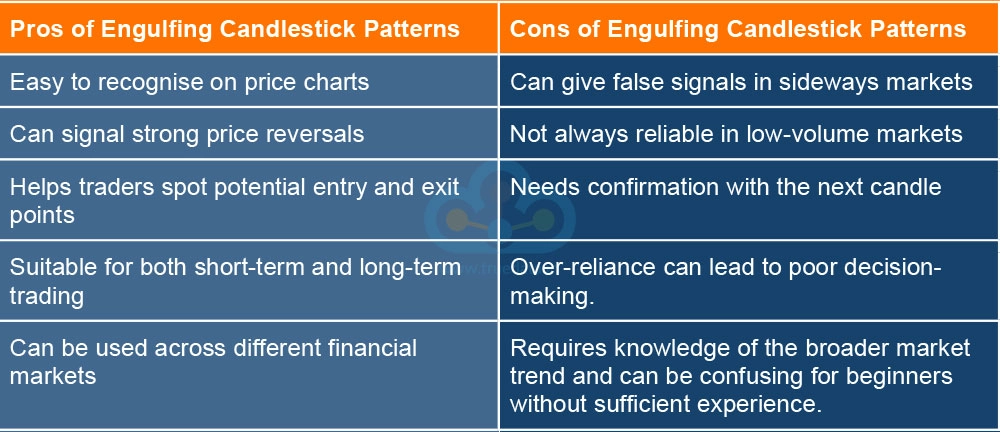
Engulfing candlestick patterns can be a powerful tool for traders in India to spot potential trend reversals and make better trading decisions. Bullish engulfing patterns indicate a possible upward trend, while bearish engulfing patterns suggest a downward shift. However, it’s important not to rely solely on these patterns and traders should confirm them with other indicators to capitalise on potentially profitable trading opportunities.
This blog is an extension to our previous blogs on candlestick patterns discussing engulfing candlestick patterns in detail. Let us know if you have any queries on this topic or need information on any other popular candlestick patterns and we will take them up in our coming blogs.
Till then Happy Reading!
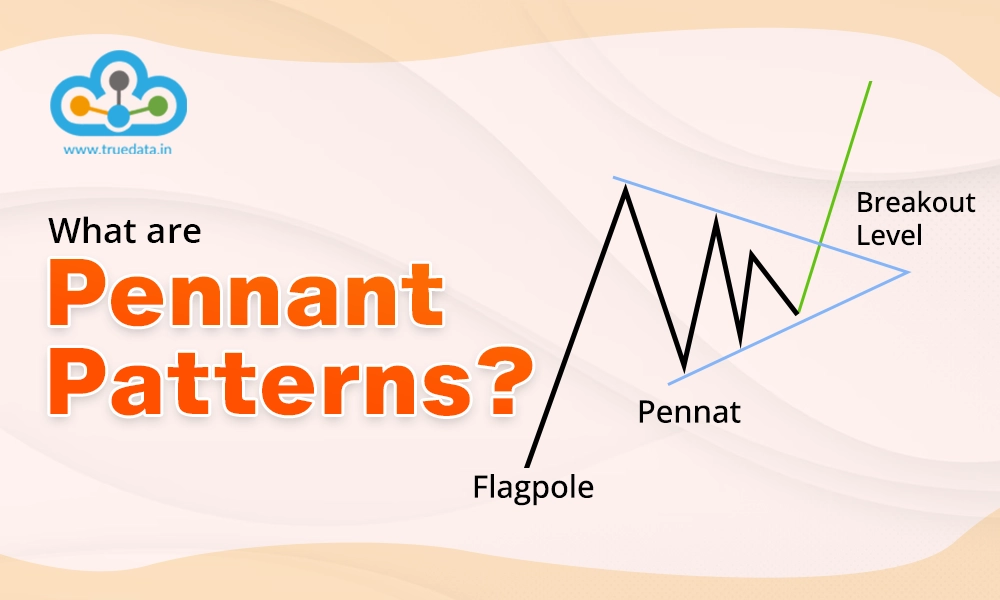
Traders rely heavily on chart patterns and candlesticks to identify trends and m...
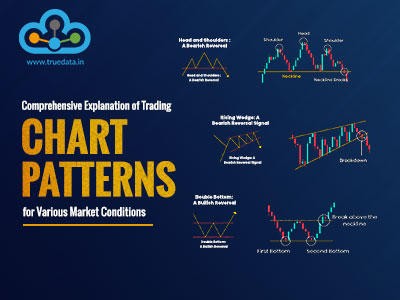
The use of technical analysis for trading is vital for creating a successful tr...
Stock markets have been under a lot of pressure in the past week and investors ...