
It is a fact that technical analysis is the basis of analysing stocks. What does technical analysis actually include? While the first aspect is analysing price movements, the other is volume analysis. Volume analysis is a major tool for trend confirmation or indication of potential trend reversal and traders use various volume indicators to back their analysis. Now the next question to address is what volume analysis means and what are volume indicators. Check out this blog to learn about them in detail and enhance your trading knowledge.
Volume analysis is the process of evaluating the number of shares or contracts traded in a security or market during a given period. It is an essential aspect of technical analysis and helps traders understand the strength or weakness of a price movement. High trading volume typically indicates strong interest in the stock, which can be a sign of significant price movements. Conversely, low trading volume suggests a lack of interest and potential price stagnation.
The importance of volume analysis can be explained hereunder.

One of the primary uses of volume analysis is to confirm price trends. If a stock is rising and the volume is increasing, it suggests that the upward trend is strong and likely to continue. Similarly, if the stock is falling and the volume is high, it indicates that the downward trend is strong. This helps traders avoid false signals and stay on the right side of the market.
Volume analysis can also help in spotting potential reversals. For instance, if a stock has been declining on low volume and suddenly shows a price increase with high volume, it might indicate a reversal or a change in trend. This is particularly useful for traders looking to buy at the bottom and sell at the top.
Volume gives insights into the market sentiment. High volumes during price increases suggest that buyers are confident, while high volumes during price decreases indicate that sellers are dominant. Understanding this sentiment helps traders make better decisions about entering or exiting trades.
Breakouts occur when a stock moves out of a defined range or pattern. High volume during a breakout confirms the move and suggests that it is genuine. On the other hand, a breakout on low volume might be a "fakeout," indicating that the price move lacks the necessary support to sustain itself. This helps traders avoid potential losses from false breakouts.
Volume analysis helps identify key support and resistance levels. When a stock price approaches these levels, the volume can indicate whether it will break through or bounce back. High volume at these levels signifies strong support or resistance, which can guide traders in setting their entry and exit points.
Volume indicators are tools used by traders to analyse the trading volume of securities and gain insights into market strength and trends. They help traders confirm price movements, identify potential reversals, and detect market momentum. Common volume indicators include the Volume Moving Averages (VMA), which smooths out volume data over a specific period to identify trends; the On-Balance-Volume (OBV), which accumulates volume data to show buying and selling pressure; and the Volume Price Trend (VPT), which combines price and volume changes to indicate the direction of the trend. Incorporating these volume indicators into their trading strategies can enhance traders’ abilities to make informed decisions in the NSE and BSE markets by providing a clearer picture of market dynamics and investor behaviour.
Volume indicators are the tools used by traders for effective volume analysis. The top volume indicators used in this process are mentioned below.
")
The On-Balance Volume indicator or OBV indicator accumulates volume data to show whether money is flowing into or out of stock. It adds the volume on up days (when the stock closes higher) and subtracts the volume on down days (when the stock closes lower). A rising OBV line indicates that buying pressure outweighs selling pressure, which can signal a bullish trend. A falling OBV line suggests that selling pressure is dominant, indicating a bearish trend. Traders can use OBV to confirm price movements and spot potential reversals.
")
The Accumulation/Distribution Line measures the cumulative flow of money into and out of a stock. It takes into account both price and volume, providing insights into the underlying buying and selling pressure. If the A/D line is rising, it indicates accumulation, meaning that buyers are dominating the market. If the A/D line is falling, it indicates distribution, meaning that sellers are in control. This indicator helps traders understand whether a stock is being accumulated or distributed by the market, aiding in decision-making.
")
The Chaikin Money Flow indicator measures the amount of money flowing in and out of a stock over a specific period, usually 21 days. It compares the closing price to the high and low prices, weighted by volume. A positive CMF value indicates buying pressure, while a negative CMF value indicates selling pressure. Traders can use CMF to confirm price trends and identify potential buying or selling opportunities based on money flow patterns.
")
The Volume Moving Average is a tool that smooths out volume data over a specific period to help identify trends. For example, a 20-day VMA takes the average volume of the past 20 days and plots it as a line on the chart. If the current volume is consistently above the VMA line, it indicates strong buying interest and can confirm an upward price trend. Conversely, if the volume is below the VMA line, it suggests weak buying interest or increasing selling pressure.
The pros and cons of using volume indicators are crucial in understanding the effective use and application of volume analysis. Here is a snapshot of the same.

Volume analysis is a strong pillar of technical analysis and is used in correlation with analysing price movements to understand the overall market direction and market sentiment. Traders use volume analysis for a better understanding and implementation of trading plans by adjusting trading strategies to meet individual goals. However, like any other aspect of technical analysis, volume analysis alone is not free from limitations and therefore should not be used as a single factor for market analysis.
This article talks about volume analysis and its importance in trading in brief. Let us know if you have any queries on this topic or need further details on the same and we will take it up in detail.
Till then Happy Reading!
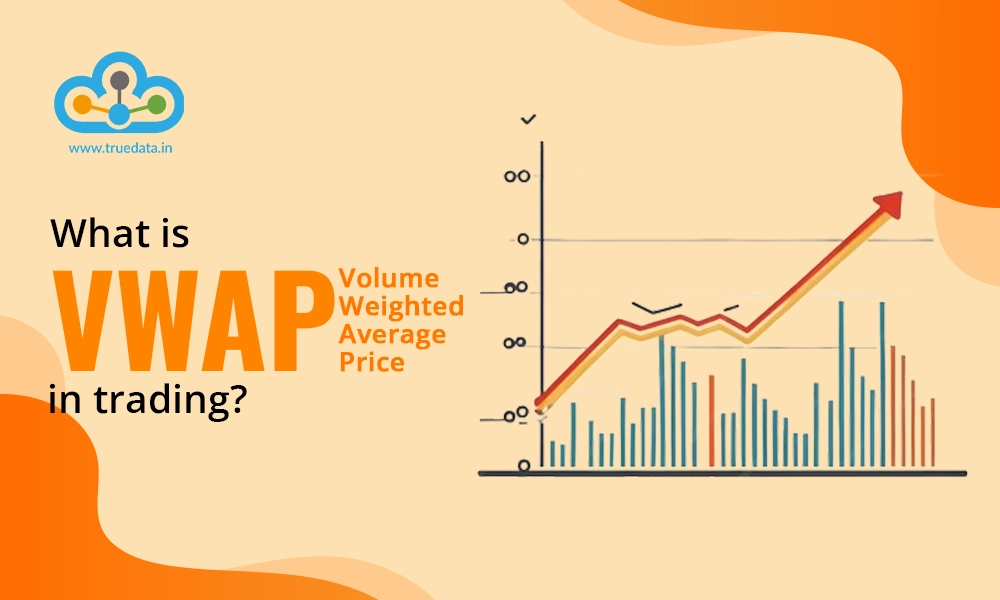
Read More: What is VWAP - Volume Weighted Average Price in Trading?
Marisha Bhatt is a financial content writer @TrueData.
She writes with the sole aim of simplifying complex financial concepts and jargon while attempting to clarify technical and fundamental analysis concepts of the stock markets. The ultimate goal is to spread vital knowledge and benefit the maximum audience. Her Chartered Accountant background acts as the knowledge base to help clarify crucial concepts and create a sound investment portfolio.
Does volume indicate buy or sell?
Volume in itself does not directly indicate buy or sell, but rather just the number of shares or contracts being traded, i.e., the relative activity for the asset. However, a sudden increase in the volume can reflect strong interest which may be due to increased buying or selling pressure depending on the market trend. Hence volume analysis has to be complimented with other technical analysis indicators and tools. We hope this resolves your query. Thank you for reaching out to us and let us know if you need further information on the topic.
The world of trading is like a maze with a constant race to find the optimum tra...
With the outcome of the Indian General Elections around the corner, theIndian st...
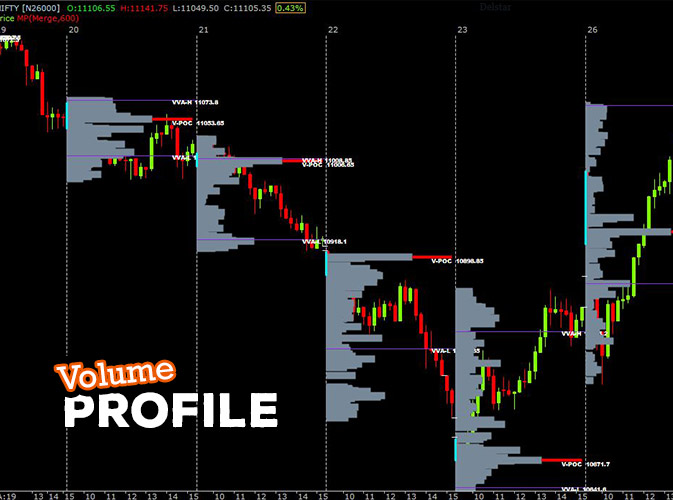
What is Volume Profile? Volume Profile is a visual representation of how muc...