
Volume Profile is a visual representation of how much volume occurs at each price over a certain period. It helps traders to identify support and resistance. By looking at volume we can see where the most activity is taking place historically.
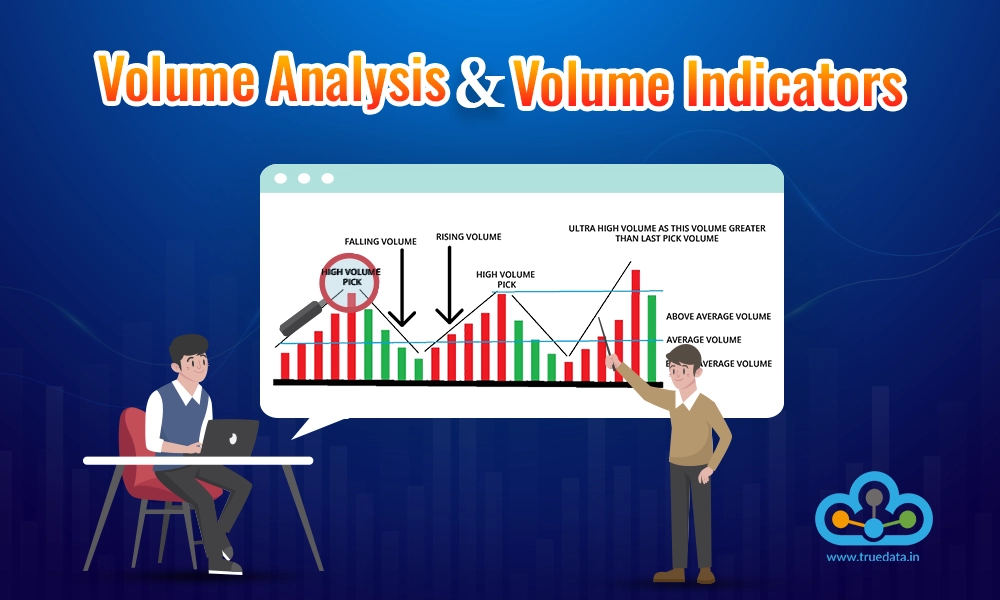
This is used to identify Support and Resistance. Volume Profile also includes High volume nodes (HVNs) where prices are deemed as fair prices. These are the prices where traders spend most of their time. HVN attracts market activity. In contrast to HVNs, where prices are deemed as unfair prices are known as Low volume nodes ( LVNs), at these prices, traders spend no or little time. LVN tends to reject market activity.
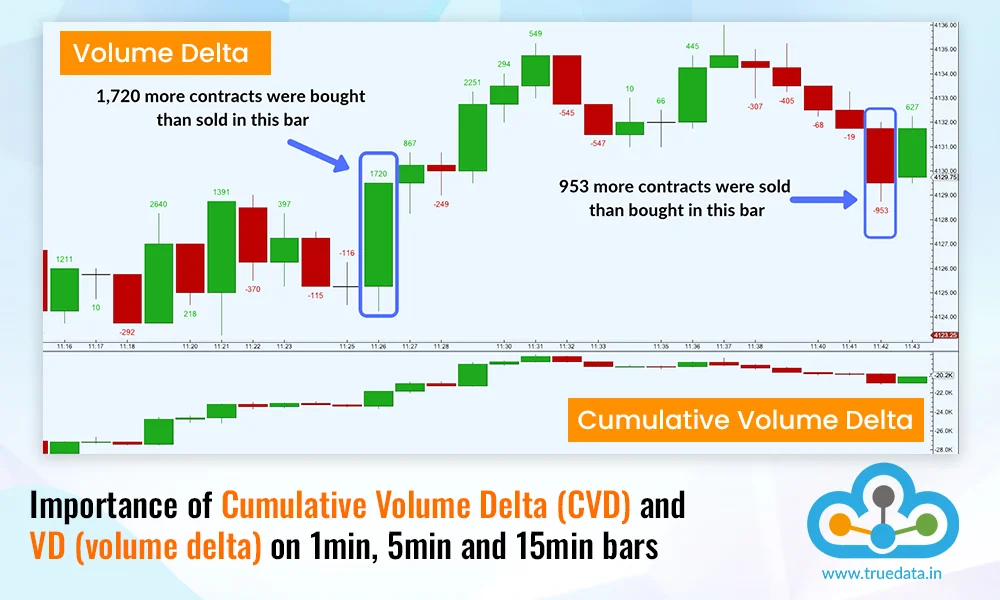
The Volume Profile takes account of the total volume traded at a particular price level during the specific duration and divides the total volume into either “buy volume” or “sell volume”. This makes it easier for the trader to understand the information.
The first and most important use of the Volume profile is to find basic support and resistance levels. It is a reactive method to identify support and resistance. This means the method relies on past price movements and volume behavior unlike proactive methods (such as trend lines and moving averages) which are based on current price action and analysis to predict future price movements. It can also help apply meaning to price levels that the market has visited earlier.
Volume Profile is an exceptionally valuable tool for technical analysis for traders. It is a charting tool that does a variety of things that are helpful while trading The data that is provided by Volume Profile is quite certain. While in its simplest form, it is a great reactive method for analyzing and finding traditional support and resistance areas. It is capable of comparing a real-time event (the current day’s open) with historical events (the previous day’s profile) and making the best decision based on the connection of the two.
Welcome to our blog!
This blog is a collaborative effort and was compiled by multiple members of the TrueData Team
The world of trading is like a maze with a constant race to find the optimum tra...
With the outcome of the Indian General Elections around the corner, theIndian st...
It is a fact that technical analysis is the basis of analysing stocks. What does...