
Creating a successful trading portfolio is all about understanding the market movements and the optimum entry and exit points for any trade. So what if you can spot a stock to include in your portfolio at the ripe time and maximise your ultimate profits? Yes, this is quite possible if you spot breakout stocks and the entry and exit points for them. But what are these breakout stocks? Check out this blog to know their meaning and how to find them for your portfolio.
Breakout stocks, in simple words, are stocks that have quite literally broken out of their trading range. This can be a level beyond the usual support and resistance level for the stocks or the security. To spot these breakout stocks, traders often employ various technical analysis tools like charts, indicators and candlestick patterns. Some of the common technical indicators often used to spot breakout stocks are moving averages, Bollinger Bands, or chart patterns like triangles, flags, or rectangles. A breakout stock signifies a shift in market sentiment and can also lead to increased trading volume as traders and investors react to the new price movement. Traders often use trading strategies like momentum trading or trend trading to capitalise on price movements.
Some of the common breakout patterns are explained here in detail.
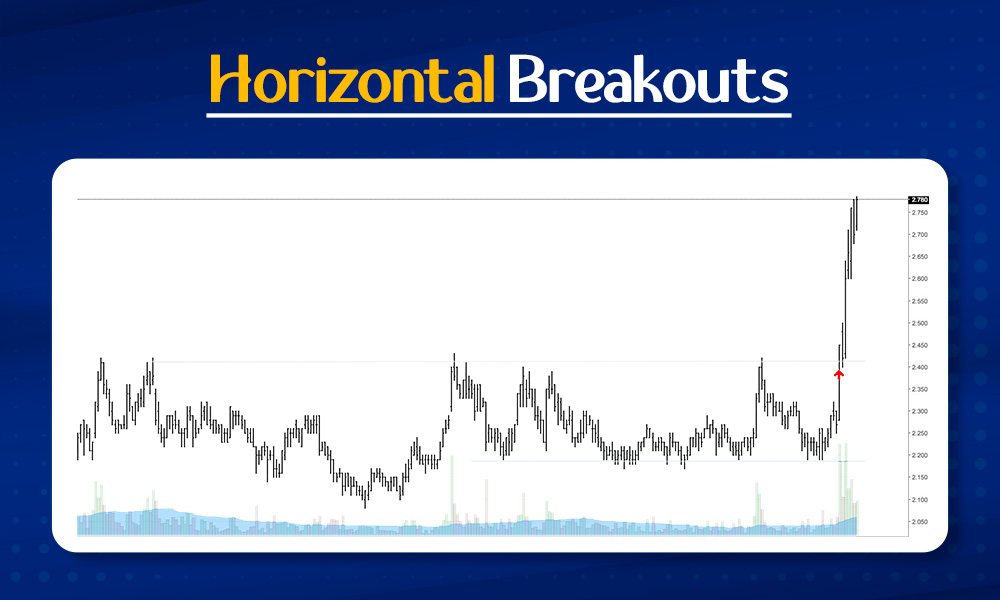
Horizontal breakouts can be further classified as Support Breakouts and Resistance Breakouts. These breakouts are explained hereunder.
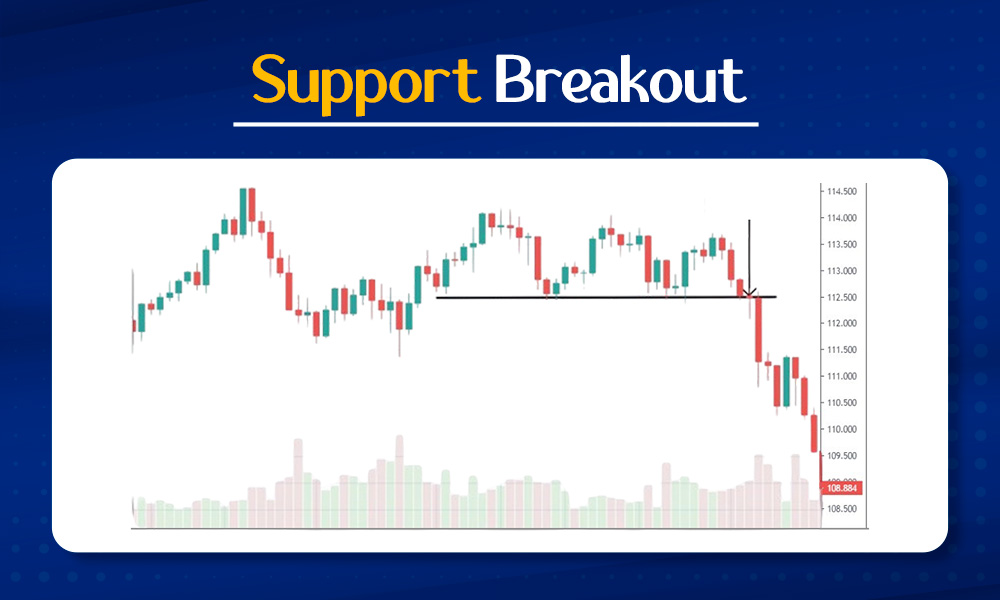
A support breakout occurs when the price of a stock or asset breaks above a significant support level. Support levels are areas where buying interest is expected to be strong enough to prevent the price from falling further. A stock breaking above a well-established support level indicates the building of a bullish momentum. This can be interpreted by traders as a signal to enter long positions or buy calls.
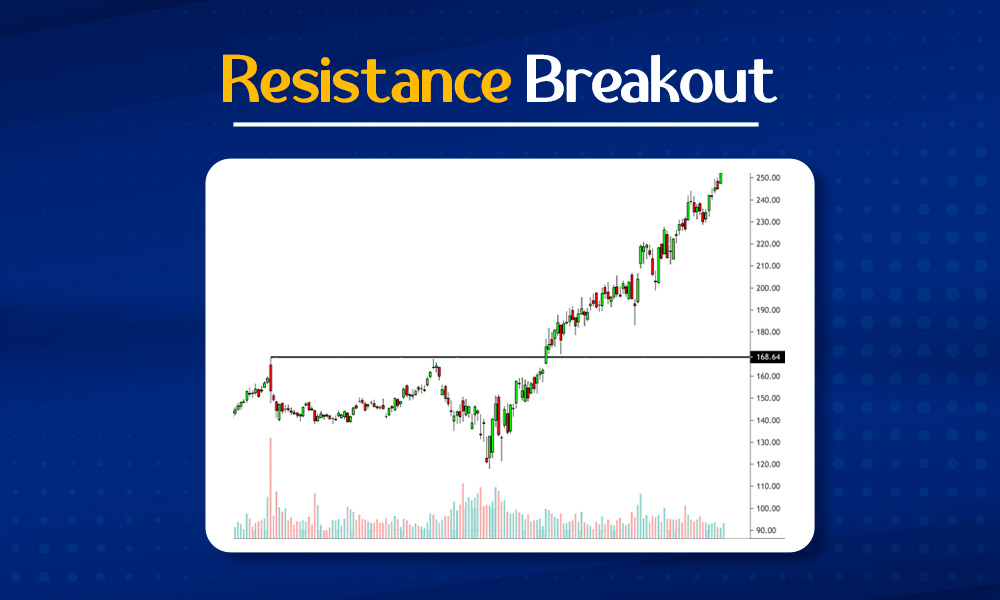
A resistance breakout is the opposite position of the support breakout where the stock price breaks out or surpasses the key resistance level. Resistance levels are areas where selling pressure is anticipated to be strong enough to prevent the price from rising further. A breakout above resistance indicates that bullish sentiment has strengthened. This can potentially lead traders to initiate long positions or buy calls and expect a further upside movement.
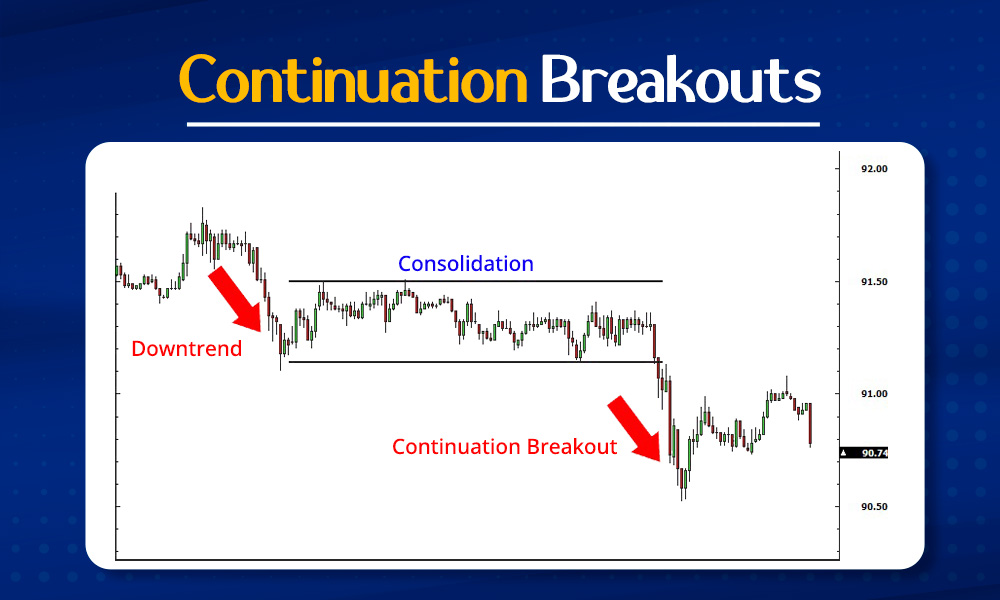
Continuation breakout patterns occur when a stock price breaks out of a consolidation phase in the direction of the existing trend, suggesting that the trend is likely to continue. The types of continuation breakout patterns are explained here.
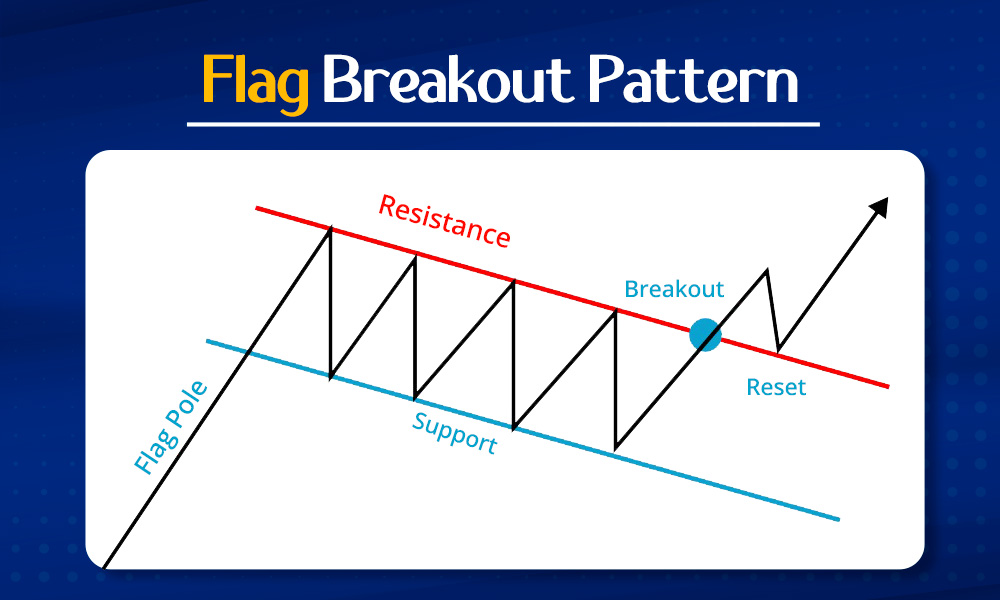
Flag patterns are continuation patterns that form after a strong price movement followed by a brief consolidation phase. In an uptrend, a flag pattern is characterised by a downward sloping consolidation. On the other hand, in a downtrend, a flag pattern shows an upward sloping consolidation. Traders can look for breakout signals when the price breaks above the flag (bullish flag) or below the flag (bearish flag), indicating a potential continuation of the previous trend.
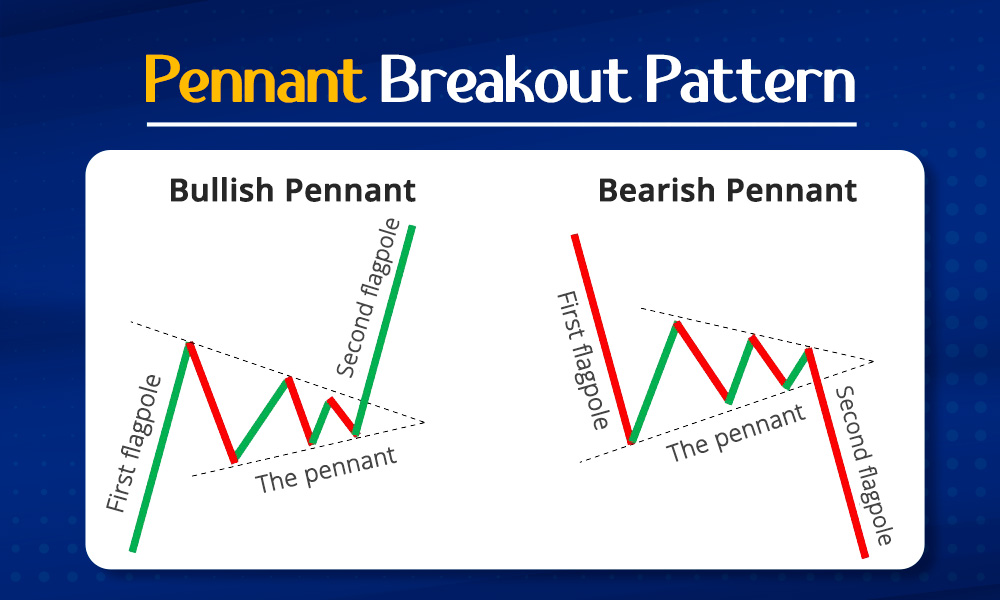
Pennant patterns are similar to flag patterns but have a triangular shape. They represent a temporary pause or consolidation within a strong trend before the price typically continues in the same direction as the prior trend. A breakout from a pennant pattern occurs when the price breaks above the upper trendline (bullish pennant) or below the lower trendline (bearish pennant), signalling a potential continuation of the trend.
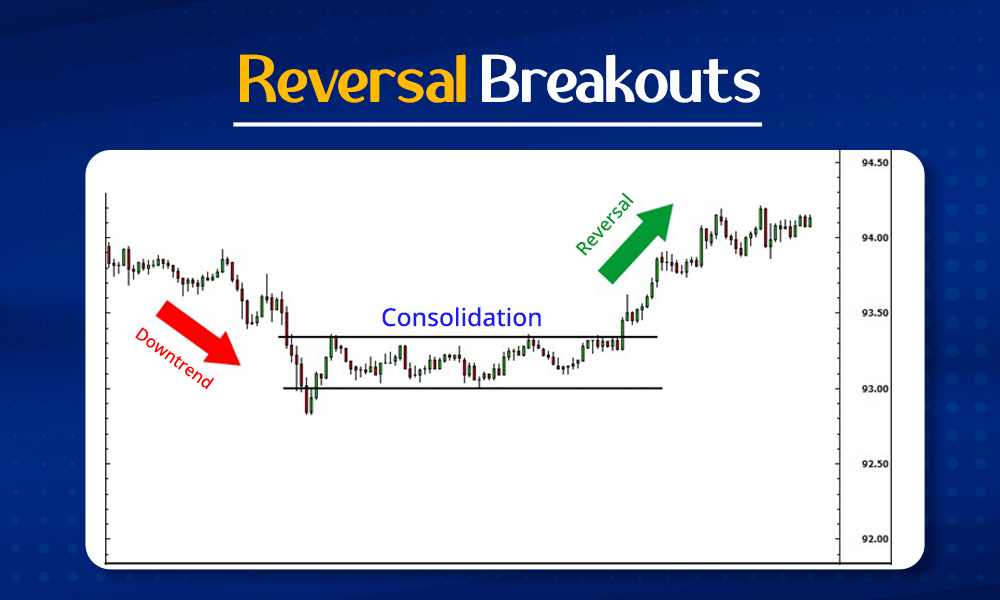
Reversal breakout patterns occur when the price of a stock breaks out of a trend in the opposite direction. This indicates a potential reversal of the previous or the existing trend. Traders often watch for these patterns to anticipate changes in market direction. The reversal breakout patterns are explained hereunder.
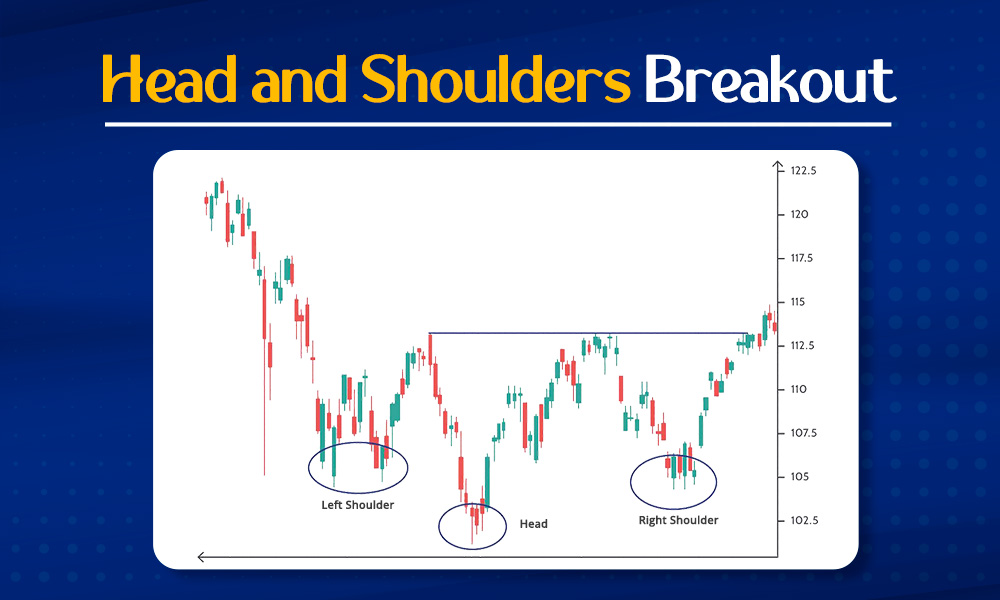
The head and shoulders pattern is a classic reversal pattern consisting of three peaks - a higher peak (head) between two lower peaks (shoulders). A breakout occurs when the price breaks below the neckline, which connects the lows of the two shoulders. This breakout signals a potential reversal from an uptrend to a downtrend (head and shoulders top pattern) or from a downtrend to an uptrend (inverse head and shoulders pattern).
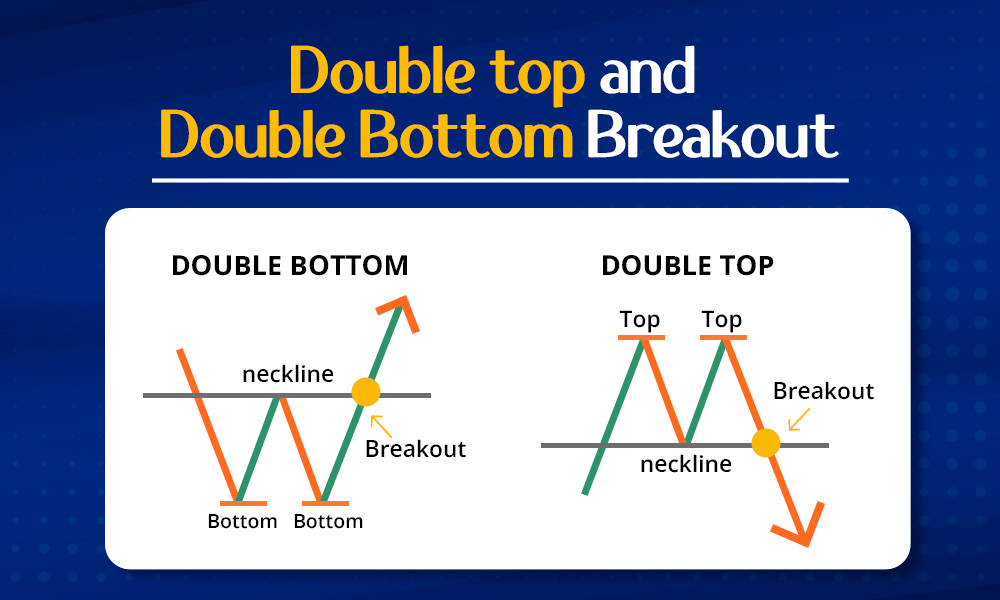
Double top and double bottom patterns are reversal patterns that occur after a prolonged trend. A double top forms when the price reaches a resistance level twice with a moderate decline in between, and a breakout below the neckline indicates a potential downtrend reversal. Conversely, a double bottom forms when the price reaches a support level twice with a moderate rise in between, and a breakout above the neckline suggests a potential uptrend reversal.
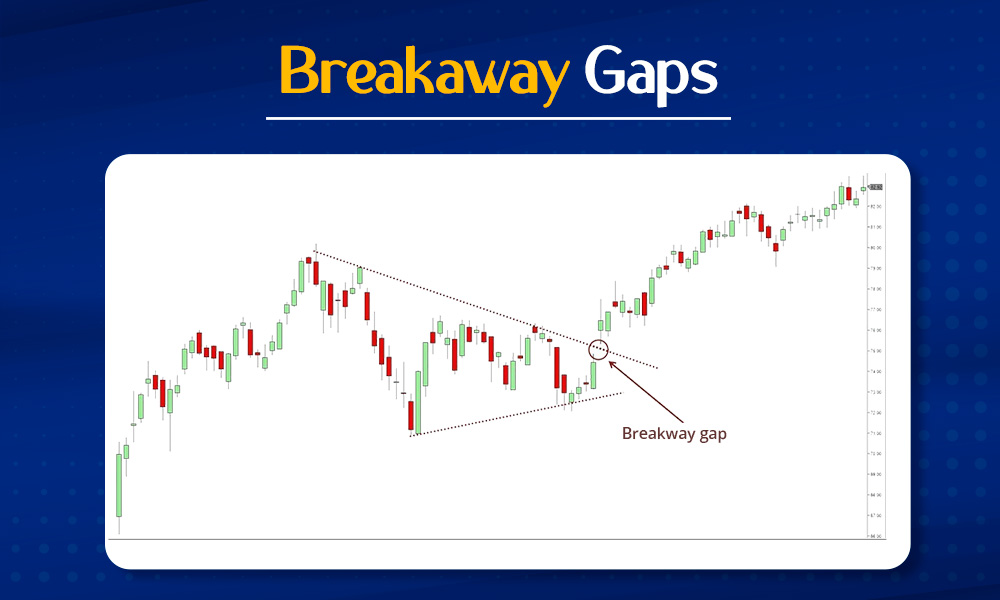
A breakaway gap occurs when the price ‘gaps’ above a significant resistance level (bullish breakaway gap) or below a significant support level (bearish breakaway gap). This type of breakout is often accompanied by high trading volume and can signal the start of a new trend, with traders looking to capitalise on the momentum generated by the gap.
Finding the best breakout stocks is a crucial aspect of creating a successful trading portfolio, especially for traders who actively seek opportunities in the dynamic stock market. A few steps or ways to find breakout stocks are discussed below.
The first and foremost step in finding breakout stocks is using various technical analysis tools. Some of such tools include,
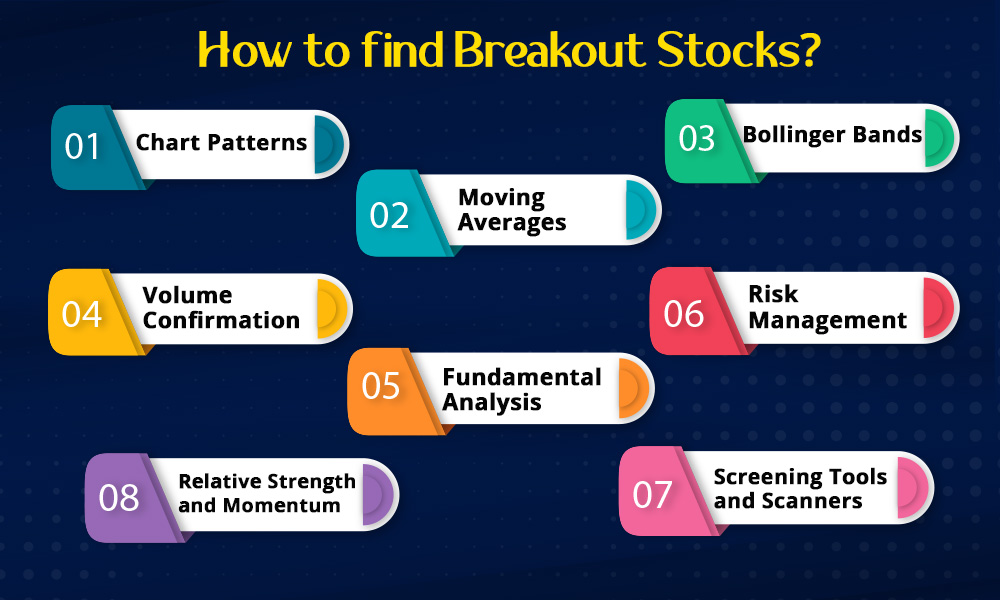
One of the primary methods to identify the best breakout stocks is through chart patterns. Common patterns include triangles (ascending, descending, symmetrical), flags, pennants, head and shoulders, double top and double bottom. Traders analyse these patterns to spot consolidation phases followed by potential breakout points. These patterns can be used to identify signals for a change in trend or a continuation of the current trend.
Moving averages are commonly used by traders to analyse price movements. Moving averages such as the 50-day and 200-day moving averages help traders identify trends and potential breakout levels. For example, a crossover of shorter-term moving averages above longer-term moving averages (golden cross) or vice versa (death cross) can indicate potential breakout or breakdown points.
Bollinger bands are indicators that help traders gauge volatility and identify potential breakout levels. These bands are useful tools for understanding market dynamics and making informed trading decisions. If the stock price surpasses the upper Bollinger Band, it signals an overbought situation. On the other hand, if the stock price falls below the lower Bollinger Band, it indicates or signals an oversold condition. Traders often expect either a continuation of the current trend or a possible reversal.
Breakouts accompanied by high trading volume often signal strong market interest and increase the reliability of the breakout. Traders look for volume spikes during breakout periods, indicating increased participation and potential follow-through in the direction of the breakout. Volume confirmation is particularly crucial for confirming breakout validity and distinguishing between genuine breakouts and false breakouts, which occur when prices briefly breach a level but fail to sustain the movement.
Traders should assess the relative strength of a stock compared to its sector or the overall market. Stocks showing relative strength and positive momentum are more likely to sustain breakout moves. Momentum indicators like the Relative Strength Index (RSI) and Moving Average Convergence Divergence (MACD) can provide additional confirmation of breakout strength and potential continuation or reversal.
While technical analysis is essential for identifying breakout candidates, traders should also consider fundamental factors. These include earnings growth, revenue growth, market share, sector outlook, news catalysts, and overall market sentiment. Stocks with strong fundamentals combined with technical breakout signals offer compelling opportunities for traders looking for sustainable price movements.
Traders can leverage screening tools and scanners provided by new age trading platforms. They can filter further stocks based on predefined criteria such as price patterns, volume, moving average crossovers, and relative strength. Customisable scanners allow traders to set specific parameters and receive real-time alerts when potential breakout stocks meet their specific criteria thereby enabling swift action.
Implementing robust risk management strategies is crucial when trading breakout stocks. This includes setting stop-loss orders to limit potential losses, determining position sizes based on risk tolerance, and avoiding overtrading or chasing momentum without proper risk assessment. Traders should also consider the broader market conditions, news events, and geopolitical factors that can impact breakout stocks and adjust their strategies accordingly.
Breakout stocks play a vital role in shaping trading strategies as they represent the potential changes or reversals in trends or continuation of trends after a period of consolidation. Analysing breakout stocks can provide optimum trading opportunities for traders and help in minimising losses as well as an opportunity to gain maximum profits. However, traders need to be cautious of the risks of trading in breakout stocks to be well aware of false breakouts. Therefore, the key to successful trading in breakout stocks is to combine an approach of continuous learning, disciplined execution and adapting to the changing market environment.
This article talks about breakout stocks and how to find them as well as shape your trading plan based on breakout trading strategy. Let us know if you have any queries regarding the same or need further information on this topic.
Till then Happy Reading!
Read More: What is meant by Buying the Dip?
Click Here to Get Live and On-Demand Market Data Feed and API from TrueData

Introduction For the longest time, investment in stock markets was thought to b...

Process of Selecting Top Stocks for Investing The first step towards picking a ...

Like starting any new venture, the first step in stock investments is knowing t...