-and-VD-(volume-delta)-on-1min,-5min-and-15min-bars.webp "Importance of Cumulative Volume Delta (CVD) and VD (volume delta) on 1min, 5min and 15min bars")
The world of trading is like a maze with a constant race to find the optimum trading opportunities and create a successful trading portfolio. This involves using multiple trading strategies and indicators based on the trading plan and the individual risk appetite of any trader. Among the many trading indicators, let us focus on volume delta and cumulative volume delta in this article. Know all about these indicators and their importance in charts of different timeframes.

Volume delta is a technical analysis tool that traders use to assess the relationship between price movements and volume in the financial markets. The concept of volume delta (VD) is based on the idea that changes in trading volume can provide important insights into market sentiment. It measures the net difference between buying volumes and selling volumes at each price level within a given period. By analysing this data, traders can identify the areas of significant buying or selling interest.
Volume delta is typically represented as a histogram or bar chart that shows the volume imbalances at different price levels. For instance, if there's a higher volume of buy orders at a certain price level compared to sell orders, the volume delta for that level would be positive, indicating bullish sentiment. Conversely, a negative volume delta suggests more selling pressure.
The formula for Volume Delta is,

Volume Delta (VD) = Bid Volume − Ask Volume
Let us understand the calculation of VD using an example.
Consider analysis of the trading activity for a stock over a one-minute interval. During this minute,
Bid Volume (Buying Volume)- 500 shares
Ask Volume (Selling Volume)- 300 shares
Using the formula for Volume Delta -
Volume Delta (VD) = 500 − 300
Volume Delta (VD) = 200
In this example, the Volume Delta (VD) is positive (+200). This means that during that one-minute interval, there were 200 more shares bought (bid volume) than sold (ask volume). Positive Volume Delta typically indicates bullish sentiment or buying pressure.
Conversely, if the numbers were reversed,
Bid Volume - 300 shares
Ask Volume - 500 shares
Volume Delta (VD) = 300−500
Volume Delta (VD) = −200
In this scenario, the Volume Delta (VD) is negative (-200), indicating that during that one-minute interval, there were 200 more shares sold (ask volume) than bought (bid volume). Negative Volume Delta often suggests bearish sentiment or selling pressure.
Traders use volume delta to confirm price trends and identify potential reversal points. For example, during an uptrend, increasing positive volume delta can indicate strong buying support, reinforcing the bullish trend. Conversely, a divergence between price movement and volume delta may signal a weakening trend or an upcoming reversal. Volume delta is also useful in intraday trading to identify short-term opportunities. Traders may look for price levels with significant positive or negative volume deltas to pinpoint potential entry or exit points. Furthermore, volume delta analysis alongside other technical indicators such as moving averages or support/resistance levels can help in enhancing trading strategies.
.webp "What is Cumulative Volume Delta (CVD)")
Cumulative Volume Delta (CVD) is an advanced technical analysis tool that builds upon the concept of volume delta to provide a comprehensive view of buying and selling pressure in the financial markets. It is the cumulative measure that tracks the net difference between buying volume and selling volume over multiple price bars or a specified time period. CVD overcomes the limitation of volume delta (VD) where the volume imbalances at each price level are looked at in isolation. CVD aggregates these imbalances to show the cumulative flow of buying and selling activity.
The calculation of CVD involves adding up the volume delta values for each price bar or time period. Positive volume delta values (indicating more buying volume) are cumulatively added to the CVD, while negative values (more selling volume) are subtracted. This process results in a continuous line or histogram that represents the cumulative buying/selling pressure over the specified period.
The formula for calculating CVD is,

CVD = CVD (previous) + Volume Delta (current)
Where,
CVD = Cumulative Volume Delta for the current period
CVD (previous) = Cumulative Volume Delta for the previous period (initially set to 0 or a starting value
Volume Delta (current) = Volume Delta for the current period (the net difference between buying and selling volume)
Let us understand the calculation of CVD using an example.
Consider a hypothetical scenario of trading activity for a particular stock over five consecutive days, along with the corresponding volume delta values.
Day 1- Price closes at 100, Volume Delta = +500 (more buying volume)
Day 2- Price closes at 105, Volume Delta = -300 (more selling volume)
Day 3- Price closes at 110, Volume Delta = +700 (more buying volume)
Day 4- Price closes at 108, Volume Delta = -200 (more selling volume)
Day 5- Price closes at 112, Volume Delta = +400 (more buying volume)
Calculating the Cumulative Volume Delta (CVD) using the above formula.
Day 1 (Initial Calculation) -
CVD (Day 1) = CVD (previous) + Volume Delta (Day 1)
CVD (Day 1) = 0+500 = 500
Day 2 (Cumulative Calculation) -
CVD (Day 2) = CVD (previous) + Volume Delta (Day 2)
CVD (Day 2) = 500-300 = 200
Day 3 (Cumulative Calculation) -
CVD (Day 3) = CVD (previous) + Volume Delta (Day 3)
CVD (Day 3) = 200+700 = 900
Day 4 (Cumulative Calculation) -
CVD (Day 4) = CVD (previous) + Volume Delta (Day 4)
CVD (Day 4) = 900-200 = 700
Day 5 (Cumulative Calculation) -
CVD (Day 5) = CVD (previous) + Volume Delta (Day 5)
CVD (Day 5) = 700+400 = 1100
Traders use CVD to analyse the strength and sustainability of price trends. A rising CVD suggests increasing buying pressure and confirms an uptrend, while a falling CVD indicates rising selling pressure and supports a downtrend. By monitoring CVD alongside price movements, traders can spot divergences that may signal potential trend reversals or continuation patterns.
The importance of VD and CVD in different time frames is mentioned below.

Intraday Scalping - CVD and VD on 1-minute bars can provide valuable insights into rapid changes in buying and selling pressure for traders focusing on short-term price movements. Scalpers can use spikes or drops in VD to identify quick entry and exit points and execute their trading strategies accordingly.
Confirmation of Momentum - A 1-minute CVD can confirm the strength of short-term price momentum. A case of rising CVD coupled with price increases or a decreasing CVD during price declines can be used to validate the momentum. This helps traders make quick decisions to shape their trading portfolio.
Risk Management - Traders can also use 1-minute VD and CVD as confirmation tools for risk management. Any sudden shifts in VD or divergences between price and CVD can be used as signals for potential reversals. This analysis can prompt traders to adjust their positions accordingly.

Trend Identification - CVD and VD on 5-minute bars help traders identify and confirm medium-term trends. Traders can use rising CVD during an uptrend or falling CVD during a downtrend to support trend identification and aid in trade direction.
Entry and Exit Strategies - Traders can use VD and CVD on 5-minute bars to determine optimal entry and exit points for medium-term trades. Significant changes in VD at key support/resistance levels or trend line breaks can signal potential trade opportunities.
Confirmation with Other Indicators - Integrating 5-minute VD and CVD analysis with other technical indicators such as moving averages or Fibonacci levels enhances trend confirmation and improves overall trading strategies.

Trend Confirmation - CVD and VD on 15-minute bars provide confirmation of longer-term trends. Traders can rely on consistent trends indicated by CVD and VD to make informed decisions for swing or position trades.
Divergence Analysis - Monitoring divergences between price and 15-minute VD/CVD can be crucial for anticipating trend reversals or continuations. Divergences may signal shifts in market sentiment, prompting traders to adjust their strategies.
Risk Assessment - Traders can assess risk on 15-minute bars by considering the stability of CVD and VD trends. Consistent patterns in CVD and VD help traders trust price changes more, making it easier for them to handle risks well.
Holistic Analysis - Analysing CVD and VD across multiple time frames (1-minute, 5-minute, and 15-minute bars) offers traders a holistic view of market dynamics. It allows for better trend confirmation, entry/exit timing, and risk management.
Adaptability - Traders can adapt their strategies based on the time frame analysis of CVD and VD. Short-term traders can capitalise on 1-minute VD/CVD for quick trades, while medium to long-term traders can rely on 5-minute and 15-minute trends for strategic decision-making.
Confirmation with Price Movements - Integrating CVD and VD analysis with price action enhances the reliability of trading signals. Confirming price movements with corresponding changes in VD and CVD can strengthen the conviction behind trade decisions.
Volume Delta and Cumulative Volume Delta are among the prominent indicators used by traders to analyse different time frames and make suitable trading decisions. Integrating the use of CVD and VD in the trading plan helps traders in enhancing trend identification improving entry or exit timing and effective risk management strategies. The use of VD and CVD can contribute significantly to trading success for beginners as well as seasoned players in the trading arena.
This article is an attempt to explain two key trading indicators and how to use them for creating a trading plan. Let us know if there are any queries related to this topic or if you need any information related to other trading indicators and we will take it up in our coming blogs.
Till then Happy Reading!
Marisha Bhatt is a financial content writer @TrueData.
She writes with the sole aim of simplifying complex financial concepts and jargon while attempting to clarify technical and fundamental analysis concepts of the stock markets. The ultimate goal is to spread vital knowledge and benefit the maximum audience. Her Chartered Accountant background acts as the knowledge base to help clarify crucial concepts and create a sound investment portfolio.
will you help me more than this/?
Certainly, sir! I kindly request that you send an email to our support ID : [email protected], regarding your query, so that our team can provide you with a detailed explanation and assist you with your requirements.
What is the delta of cumulative liquidation levels and priority of distribution in liquidation?
The delta of cumulative liquidation levels for stocks and futures shows the net difference between buy and sell liquidations over time. For example, if Nifty 50 futures have 10,000 long contracts liquidated and only 7,000 short contracts liquidated, the delta is -3,000, indicating strong selling pressure. On the other hand, if 12,000 short contracts are liquidated while only 8,000 long contracts are liquidated, the delta is +4,000, signalling buying pressure. Also, the priority distribution in liquidation depends on market conditions. Large liquidations near support or resistance levels can trigger big price moves. thus, traders can use this data to predict price changes, manage risk, and plan better entry or exit points. We hope this resolves your query. Reach out to us if you need further insights. Thank you!
nice post
Thank you Sir!
What does wigs in Cumulative Volume delta indicate?
Wicks (or spikes) in Cumulative Volume Delta (CVD) show sudden and sharp changes in buying or selling pressure. This usually means aggressive buyers or sellers entered the market quickly, causing a jump or drop in CVD. A strong upward wick in CVD suggests buyers are pushing hard, while a downward wick shows heavy selling. These wicks can signal possible reversals or the start of strong moves, especially if price does not follow the same direction, indicating a potential divergence between volume and price action. We hope this resolves your query. Thank you for reaching out to us and stay connected to TrueData for more informative content.
Great blog!
thank you for comments
Market is a zero sum game.. meaning for every buyer there has to be a seller.. if a market shows bullish movement or bearish movement then its because of aggressive market orders and not limit orders.. Market infact moves because of market orders.. so how can you say there were more buyers than sellers at any given point when for a buyer to make a buy there has to be an opposing seller?
Yes, you are right, every buy needs a sell in the market, so it is a true zero-sum game. However, when we talk about 'more buyers' or 'more sellers', it usually means more aggressive market orders on one side, pushing the price up or down. It is essentially about who is more eager at that moment. We hope this resolves your query. Keep reading and sharing your thoughts on our other topics too. We are waiting to hear more from you!
I want the delta based scanning facility with tick data. could you please help me in this. no platform is doing this
Sure Sir, you can reach us at [email protected] for more details on your requirement.
I found this Excellent topic from Tumblr. thanks for sharing .
Thank you for your lovely words, we're so glad you liked it! Tumblr always has some hidden gems :-)
one of the best post which refererred me luxalgo. Good explain
Thank you so much for the kind words! Glad to hear the post helped and that you found the explanation useful.
This is an excellent post than gocharting and Please add details about Non-sessional cumulative volume delta
Thank you so much for the kind words! We are glad you found the post helpful. Non-sessional Cumulative Volume Delta (CVD) tracks the difference between buying and selling volume continuously across multiple sessions, unlike regular CVD, which resets at the start of each trading day. We will also look at adding more detailed coverage on this topic soon. Do keep reading and sharing your thoughts with us!
How can the market rise when the cumulative volume delta indicates that sellers are in control?
The market can still rise even if CVD shows sellers in control, as strong buyers may be absorbing the selling, or prices may be moving up due to lower supply. Thus, it is important to use CVD along with price action and other indicators to get the correct picture.
is it free of cost of bookmap users
Thank you for your comment. We are no longer affiliated with the Bookmap platform. For any queries related to Bookmap such as data feed availability, pricing, or indicator viewing, we request you to please get in touch with the Bookmap team directly, as they would be the right point of contact for the same.
excellent article
Thank you for the kind words, glad you enjoyed the article.
Can you explain how to identify genuine absorption vs fake reversal using CVD divergence? Sometimes price moves up even when cumulative delta stays negative.
That is a great observation. Genuine absorption usually shows price holding or rising despite negative CVD, along with strong support, slowing selling pressure, and follow-through buying later. On the other hand, fake reversals often fail quickly with a weak price structure and no confirmation from volume or higher timeframes. We hope this addresses your concern. You can also reach us at [email protected] for more details on the topic.

Have you seen a stock rising for quite some time and then suddenly pausing or re...

It is a fact that technical analysis is the basis of analysing stocks. What does...
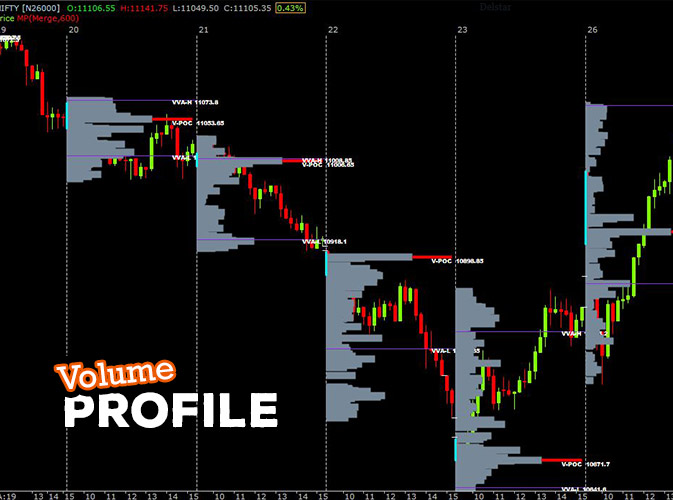
What is Volume Profile? Volume Profile is a visual representation of how muc...