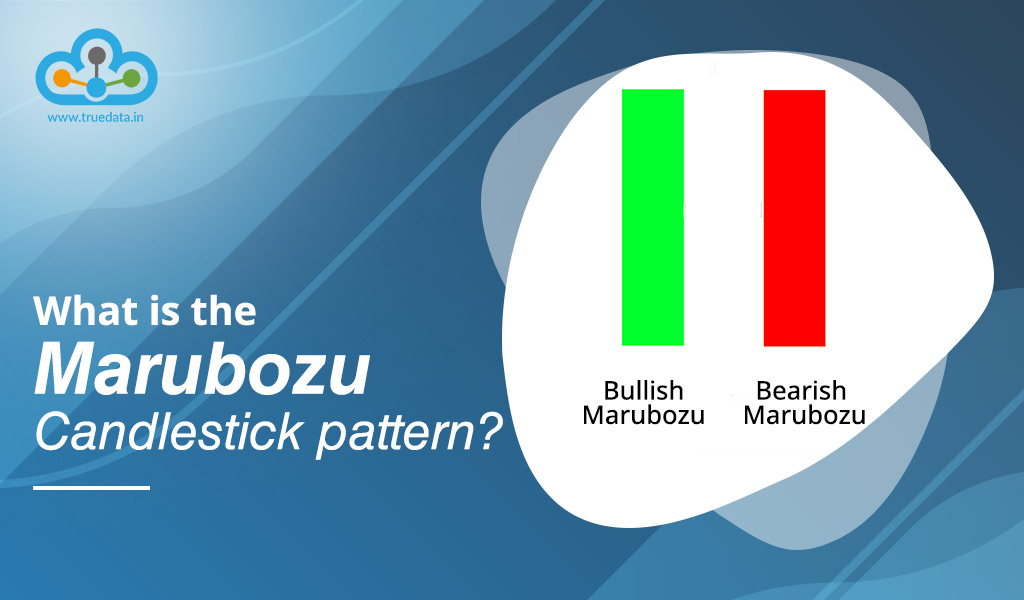
 Candlestick patterns are the most common tools used for technical analysis by traders and analysts. We have studied single candlestick patterns (Part 1) and double candlestick patterns (Part 2) in our previous articles. Now let us study a popular Japanese candlestick pattern, the Marubozu candlestick pattern. This pattern is easy to understand and implement. Given here are a few key details of this pattern.
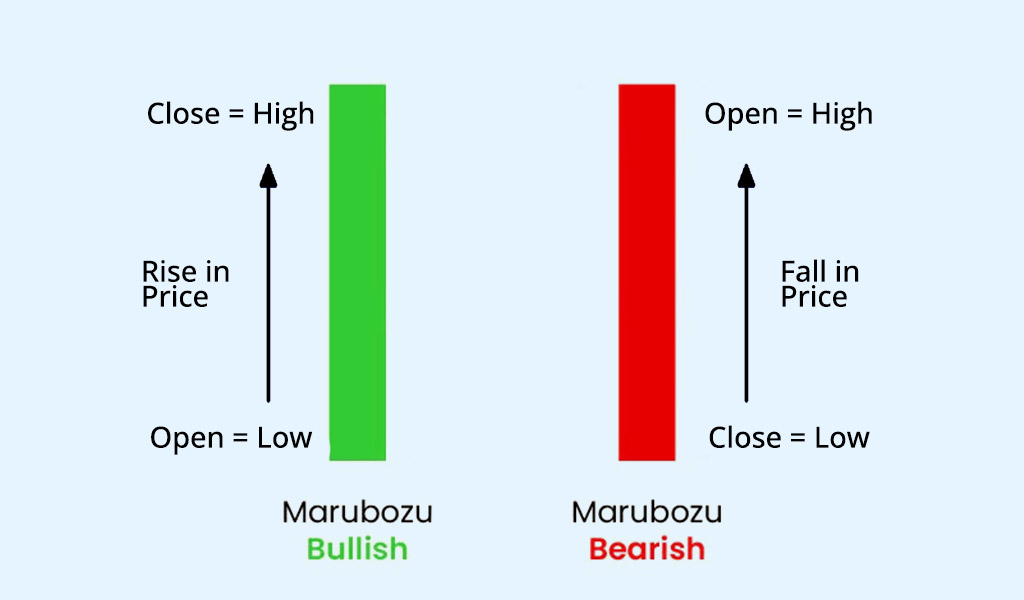 The word ‘Marubozu’ is a Japanese word that literally means bald. A Marubozu candlestick pattern is a single candlestick pattern that is formed when the opening price of a security is equal to its low price for the day (in the case of a green/white Marubozu) or when the opening price is equal to the high price for the day (in the case of a red/black Marubozu). The candlestick has no upper or lower shadow, indicating that the stock price remained in a narrow trading range for the entire day. Marubozu patterns are considered to be strong indicators of a trend because they suggest that buyers (in the case of a green/white Marubozu) or sellers (in the case of a red/black Marubozu) were in control of the market for the entire trading day. This can be helpful for traders looking to enter or exit positions, as it suggests a high degree of confidence in the direction of the trend. In simpler terms, a Marubozu candlestick pattern means that the stock opened and stayed at either its highest or lowest point for the day, with no wick or tail showing. This is a sign that the market is strongly controlled by either buyers or sellers and can help traders make decisions about buying or selling stocks.
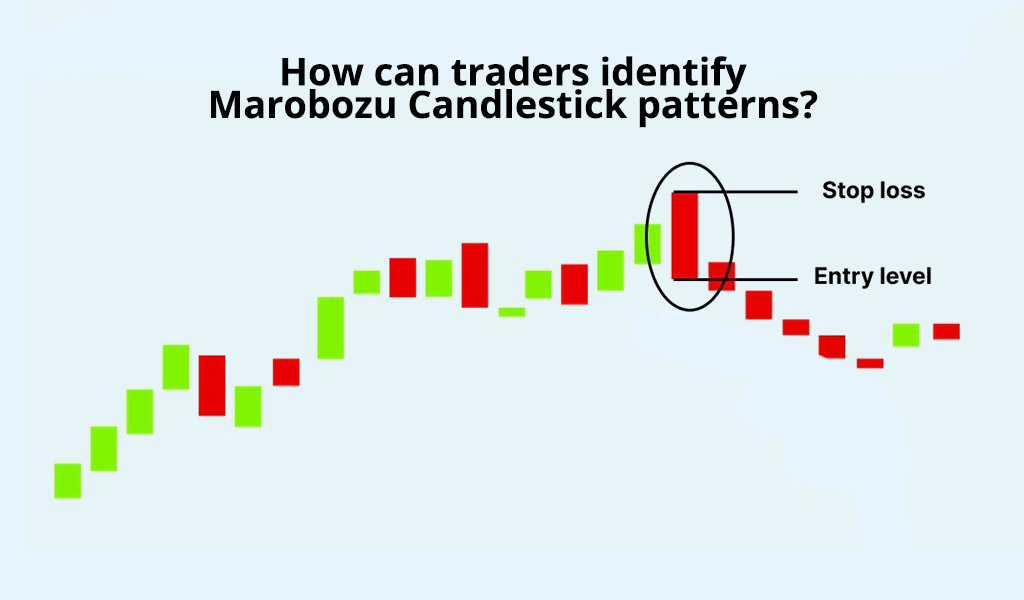 To identify a Marubozu candlestick pattern, traders should look for a candlestick with no upper or lower wick, which means that the opening price for the day was equal to the highest or lowest price, respectively, that the stock traded at during the day. In other words, if the candlestick is green/white and has no upper wick, it means that the stock opened at its low price for the day and closed at its high price for the day. On the other hand, if the candlestick is red/black and has no lower wick, it means that the stock opened at its high price for the day and closed at its low price for the day. Traders can identify Marubozu candlestick patterns by looking at a candlestick chart, which shows the price action of a stock over a certain period of time, typically a day. They can also use candlestick charting software, which can automatically identify different candlestick patterns, including Marubozu patterns.
Traders can use bullish and bearish Marubozu candlestick patterns to create a successful trading portfolio. The steps for the same are highlighted below.
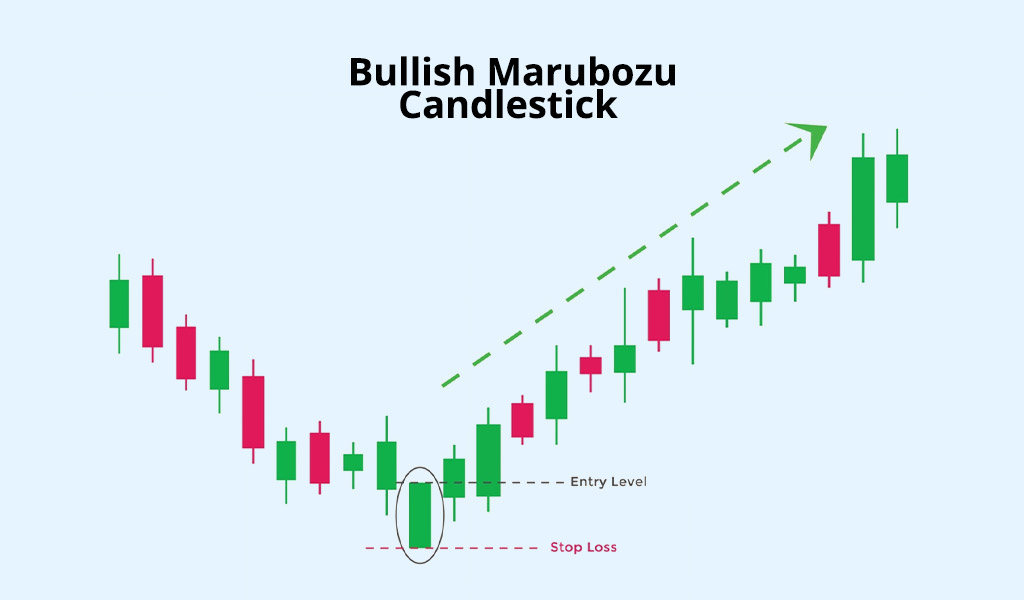 The steps to trade using the bullish marubozu candlestick pattern are given below.
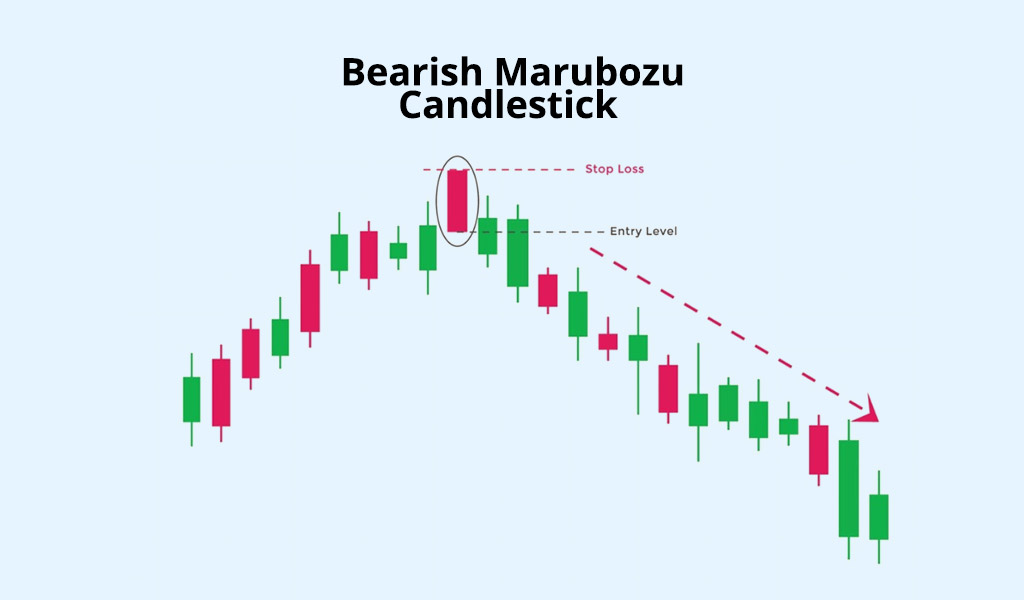 The steps to trade using the bearish marubozu candlestick pattern are given below.
Marubozu candlestick patterns are among the easy to recognise and easy-to-understand candlestick patterns. As mentioned above, these patterns can be used by traders in the bullish as well as bearish markets along with a variety of securities. This makes this pattern quite flexible and approachable for different markets like commodity markets, currency markets, etc. This article was part of the candlestick pattern series where we have broadly discussed various single and double candlestick patterns and now are taking up those patterns in detail. Let us know what you think about this pattern and if you have any questions regarding the same. Till the Happy Reading!
Candlestick patterns are among the most basic and common tools traders use to cr...

Stock markets have been under a lot of pressure in the past week and investors ...

The world oftechnical analysis is filled with many tools like candlestick patter...