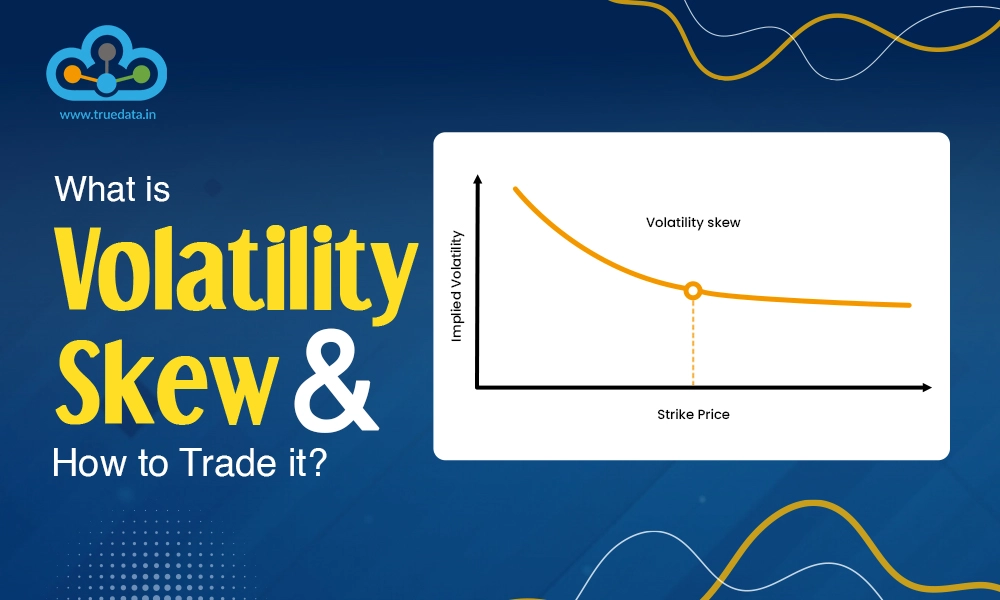
Options trading is one of the trickiest yet a prevalent trading segment in the Indian stock markets making it important for traders to understand concepts related to options trading. We have discussed various option greeks in detail in our previous blogs. Let us now understand another concept related to options trading which sheds further light on implied volatility, i.e., volatility skew. Check out this blog to learn the meaning of volatility skew and its related details.
Volatility skew refers to the pattern where options with different strike prices or expiration dates show different levels of implied volatility. In simpler terms, implied volatility is a measure of the expected price fluctuations of an asset, and traders use it to determine the price of options. Ideally, novice traders can assume options with the same underlying asset to have the same implied volatility, however, that is not always the case. Volatility skew happens when options with different strike prices (the price at which the option can be exercised) have different implied volatilities. This occurs due to market perceptions of risk, demand for particular options, or past market events, leading traders to price them differently. Traders might notice volatility skew in equity and index options like Nifty and Bank Nifty.
The common types of volatility skew are explained below,
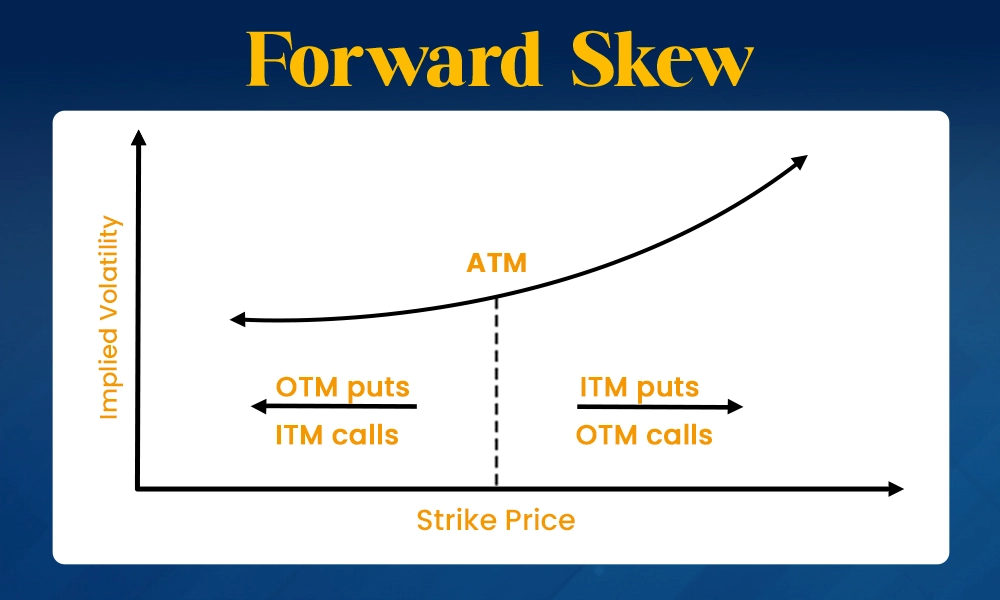
Forward skew happens when the implied volatility of out-of-the-money (OTM) calls is higher than that of OTM puts. This means traders expect future prices to rise and are willing to pay more for call options. It often appears in markets where people are more optimistic or expect a rally, and it is common in bullish trends.
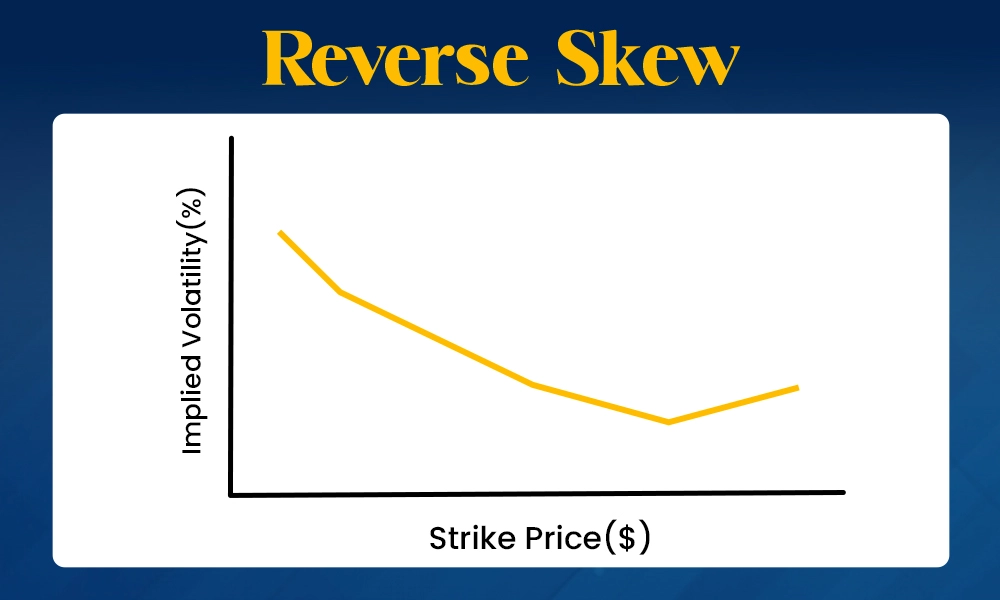
In reverse skew, the implied volatility of OTM puts is higher than that of OTM calls. This reflects a fear of falling prices. Traders are more interested in buying protection through puts, leading to higher prices for these options. Reverse skew is typical in bearish or uncertain market conditions, like during economic slowdowns or crises.
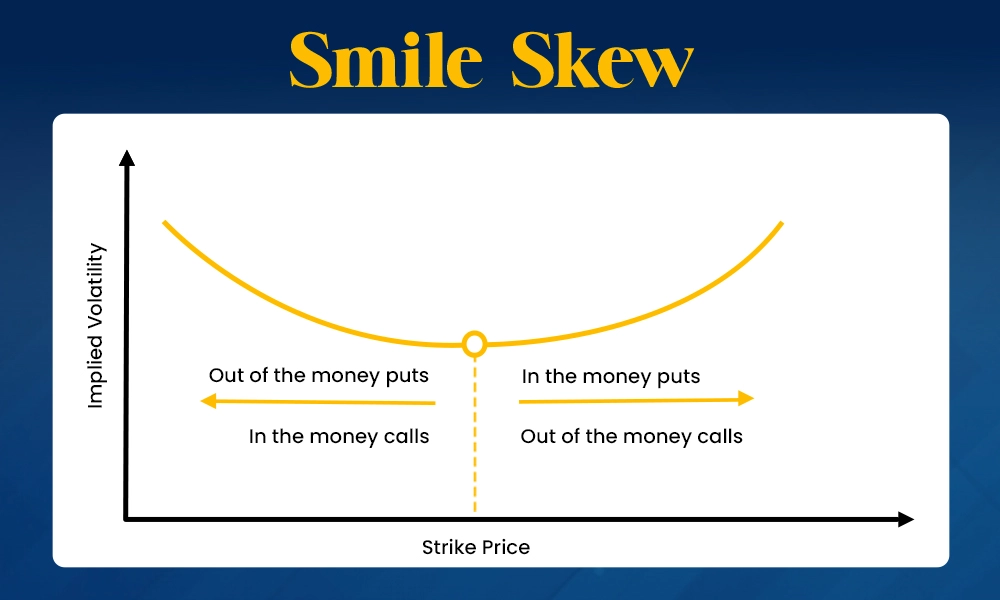
A smile skew occurs when both deep OTM calls and puts have higher implied volatility than at-the-money (ATM) options. This pattern forms a U-shape, resembling a smile. Traders expect large price movements in either direction, making both calls and puts more expensive. It is common in volatile markets, where big swings are expected.
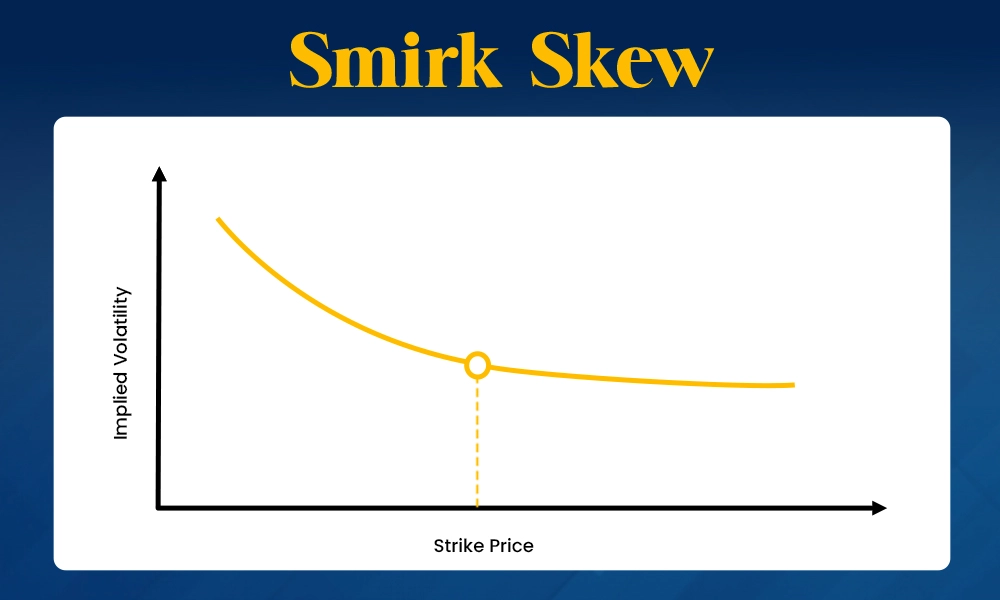
A smirk skew is when implied volatility is higher for OTM puts than for calls, but not as extreme as in a reverse skew. It often occurs when there is moderate concern about downside risk, but the market is not fully bearish. It is a middle-ground skew that reflects some caution but not extreme fear.
Volatility skew is important because it helps traders understand the market's expectations for future price movements and risk. It shows how implied volatility, which reflects the market’s view of future volatility, varies for different strike prices of options. A skew can tell traders whether there is more demand for call options (indicating bullish sentiment) or put options (indicating bearish sentiment or fear of a market drop). This insight helps traders make more informed decisions, especially when managing risk or setting up option strategies like straddles or spreads. By recognising the skew, traders can better gauge market sentiment, spot potential opportunities for profit, or take precautions against unexpected price movements.
Volatility Skew is calculated by comparing the implied volatilities (IV) of options with different strike prices, usually focusing on out-of-the-money (OTM) options.
The Formula to calculate Volatility Skew is,
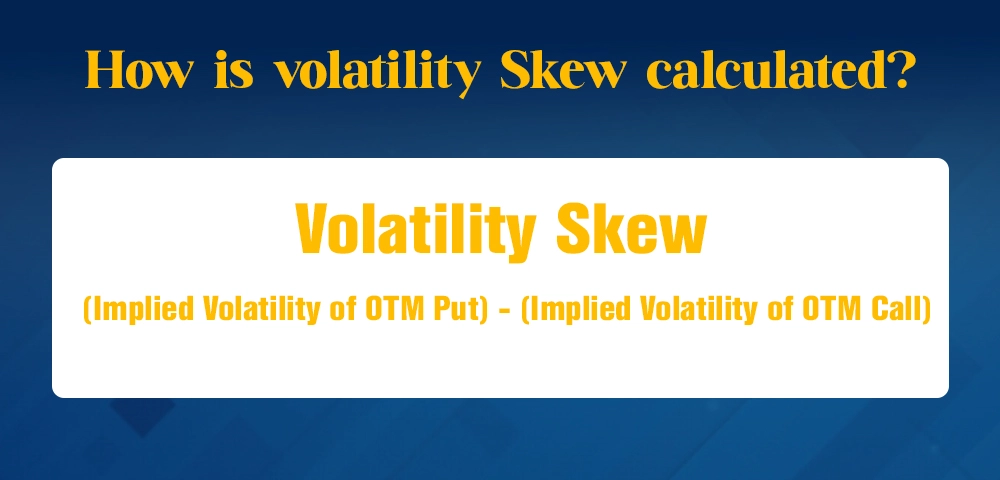
Volatility Skew = (Implied Volatility of OTM Put) - (Implied Volatility of OTM Call)
Let us consider the following example to understand the calculator of volatility skew in a simplified manner.
Consider the stock price of ABC Ltd. is Rs. 1000. The OTM Call Option (Strike Price Rs. 1100) has an Implied Volatility (IV) of 15% while the OTM Put Option (Strike Price Rs. 900) has an Implied Volatility (IV) of 20%.
Calculation of Volatility Skew based on the above data,
Volatility Skew = 20% (IV of OTM Put) - 15% (IV of OTM Call)
Volatility Skew = 5%
The positive skew (5%) indicates that traders are more concerned about a possible price drop, so they are paying more for put options (downside protection) than for call options (upside profit).
The volatility skew can be positive, negative or neutral depending on the IV of OTM Put and Call options. The interpretation of Volatility Skew for traders is explained below.
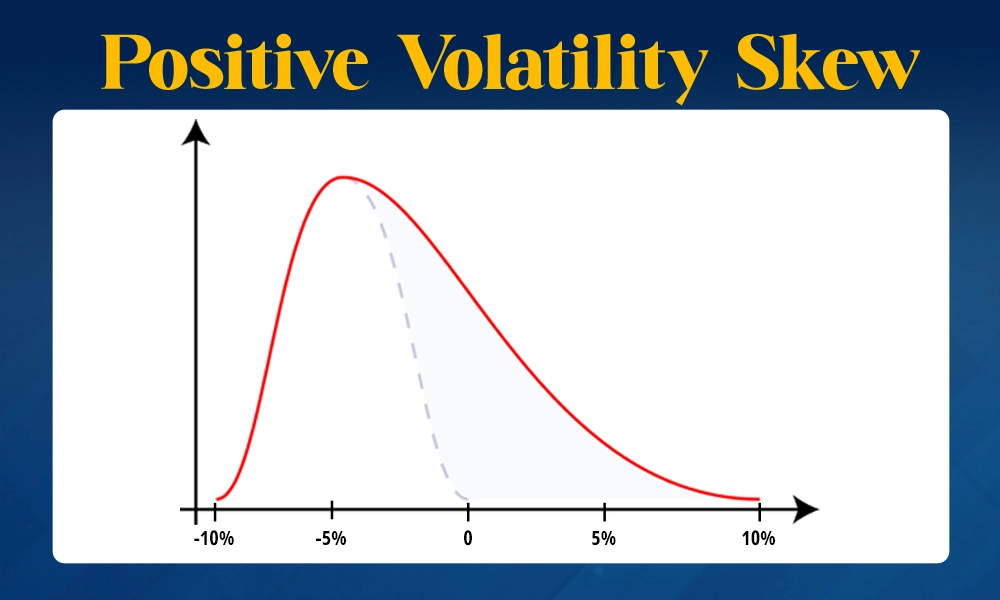
When the implied volatility of out-of-the-money (OTM) puts is higher than that of OTM calls, it creates a positive volatility skew. This means traders are more worried about the market falling, so they are paying more for put options as protection. For example, if the volatility of a Rs. 900 put is higher than that of a Rs. 1100 call, traders expect more risk of a price drop. This indicates a bearish sentiment or concern about downside risk.
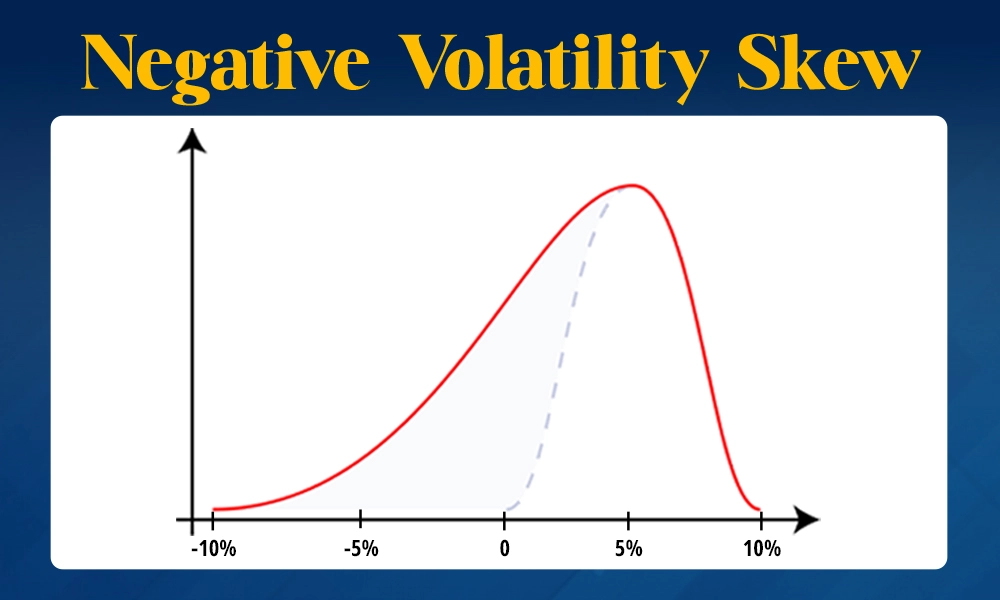
A negative volatility skew happens when the implied volatility of OTM calls is higher than that of OTM puts. This shows that traders are more optimistic about prices going up. In such cases, they are willing to pay more for call options, expecting a rise in prices. For example, if the Rs. 1100 call has a higher volatility than the Rs. 900 put, it signals a bullish sentiment, where traders expect the market to rally.
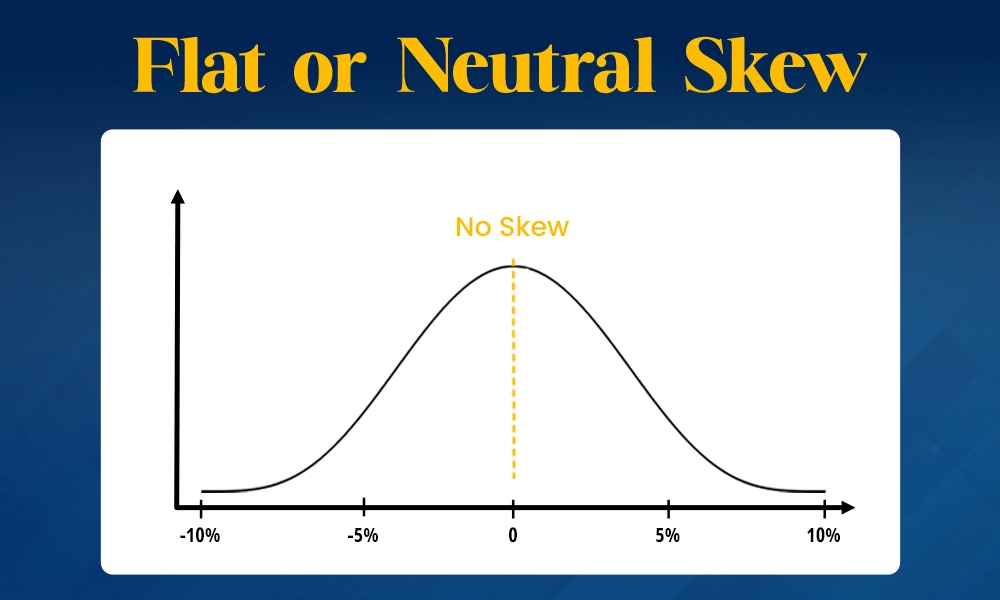
If the implied volatilities of OTM calls and puts are roughly the same, it creates a neutral or flat skew. This suggests that the market doesn’t expect big movements in either direction, and there is balanced demand for both calls and puts. Traders see the market as stable, with no strong bias toward a rise or fall in prices.
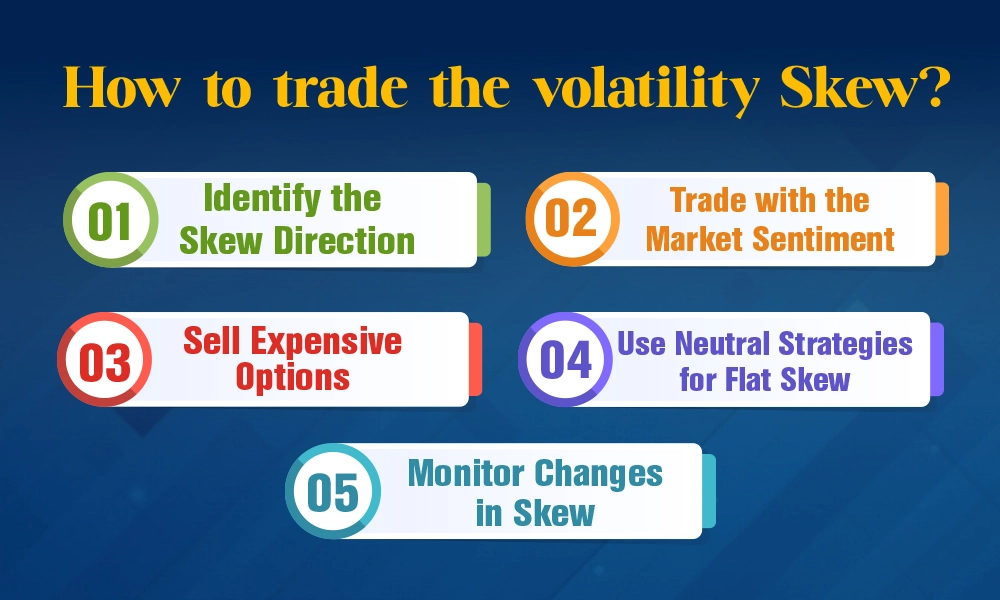
Understanding the volatility skew can help traders make informed trading decisions that can help them capitalise on profitable opportunities at the same time protect their capital from adverse risks. The use of volatility skew for trading is explained hereunder.
Identify the Skew Direction
Check if the skew is positive or negative by comparing the implied volatilities of OTM puts and calls.
Positive skew means puts are more expensive (bearish market sentiment).
Negative skew means calls are more expensive (bullish market sentiment).
Trade with the Market Sentiment
In case of positive skew, traders should consider buying puts or bearish strategies like a bear put spread, as the market is expected to fall.
In case of negative skew, traders should consider buying calls or bullish strategies like a bull call spread, as the market is expected to rise.
Sell Expensive Options
When the skew is strong (either positive or negative), sell options with high implied volatility. For example, sell OTM puts during positive skew or OTM calls during negative skew to take advantage of inflated option prices.
Use Neutral Strategies for Flat Skew
When the skew is flat (neutral), traders can use strategies like straddles or strangles that benefit from large price movements, as the market does not show a clear direction.
Monitor Changes in Skew
Traders should further track shifts in volatility skew over time to spot changes in market sentiment. A rising skew can signal fear, while a falling skew may indicate increasing confidence in the market.
Volatility skew is a valuable tool for options traders, helping them understand the different levels of implied volatility across strike prices and expiration dates. This helps traders in optimum decision-making and utilising effective strategies in case of positive, negative or neutral skew. Understanding volatility skew can help traders gauge market sentiment and potential price movements thereby managing the overall portfolio risks efficiently and improving their chances of making profitable trades in options markets
This article talks about the volatility skew which is an important concept of options trading. Let us know if you need more information on this topic or have any queries on the same and we will address them.
Till then Happy Reading!
Read More: What is Options Expiration Strategies to Avoid Traps on Options Expiration Day?
Stock markets are volatile and therefore investing in stocks and other securitie...
Thestock markets are always in a constant dance of ebb and surge of the market s...

Stock trading is not a simple and straightforward concept and requires a detail...