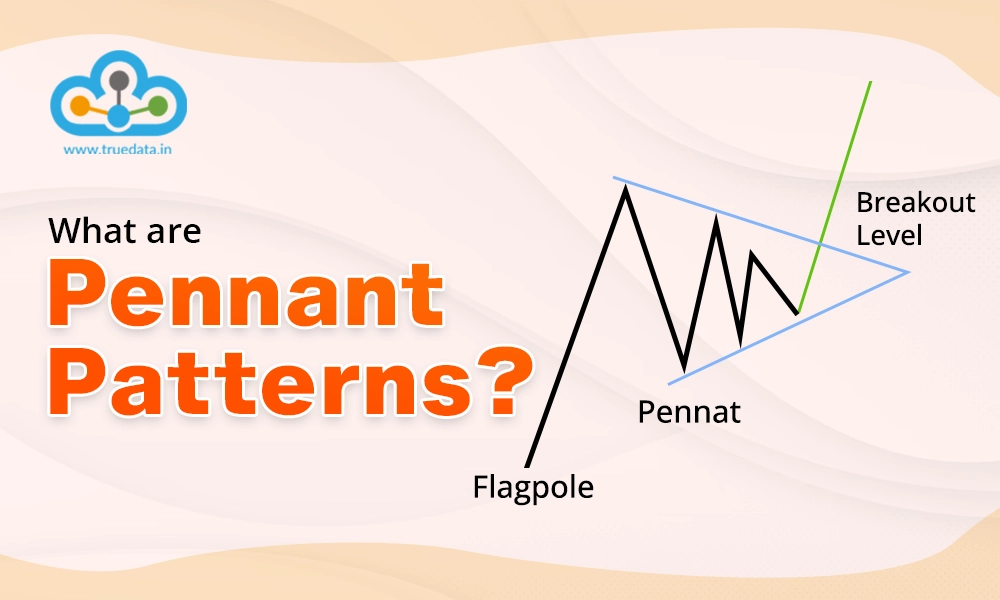
Traders rely heavily on chart patterns and candlesticks to identify trends and make informed trading decisions. In this journey, traders use multiple chart patterns to identify bullish or bearish markets. Among the many popular ones, pennant patterns are a standout that helps shape a profitable portfolio or cut losses. Here is a detailed blog on pennant patterns that can help traders identify them and use them effectively for trading.
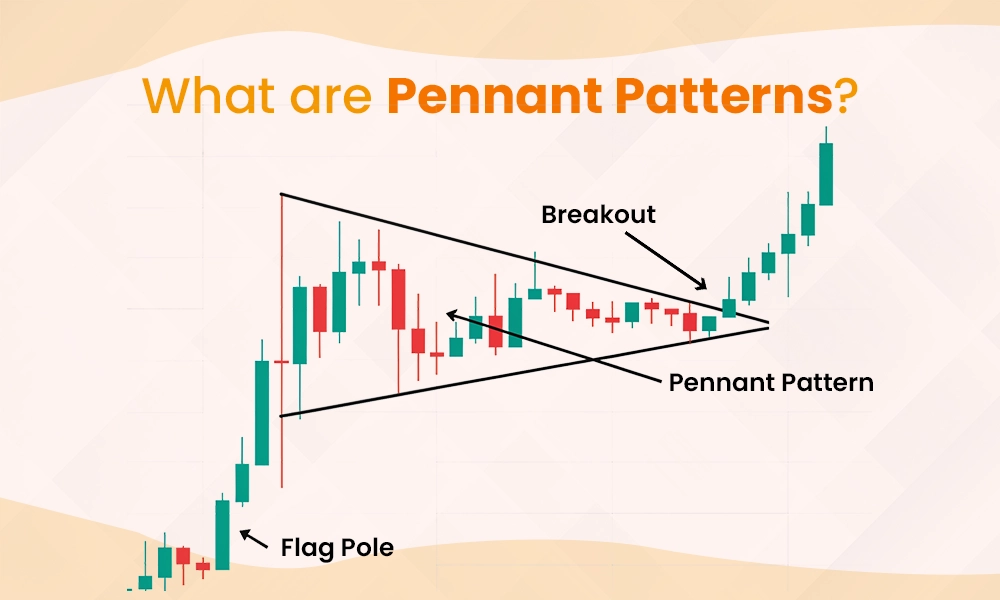
Pennant patterns are a type of chart pattern used in technical analysis to predict potential price movements in stocks, forex, or cryptocurrencies. These patterns typically appear after a strong price movement, where the market consolidates for a short period before continuing in the same direction. A pennant looks like a small triangle, formed by converging trendlines, as prices temporarily move sideways. This pattern shows that traders are taking a break after a big price move, but it usually signals that the price will continue to rise or fall after the pause. Pennant patterns can be bullish (indicating further price increases) or bearish (suggesting prices may fall). Traders can use this pattern to identify opportunities to enter or exit trades based on whether they expect the price to break upward or downward.
The key to using chart patterns and candlesticks effectively is to identify them accurately prima facie. This needs a thorough understanding of the technical analysis of stock markets and the ability to spot these patterns amidst the constant chaos of price movements. The steps or pointers to identify pennant patterns are explained below.
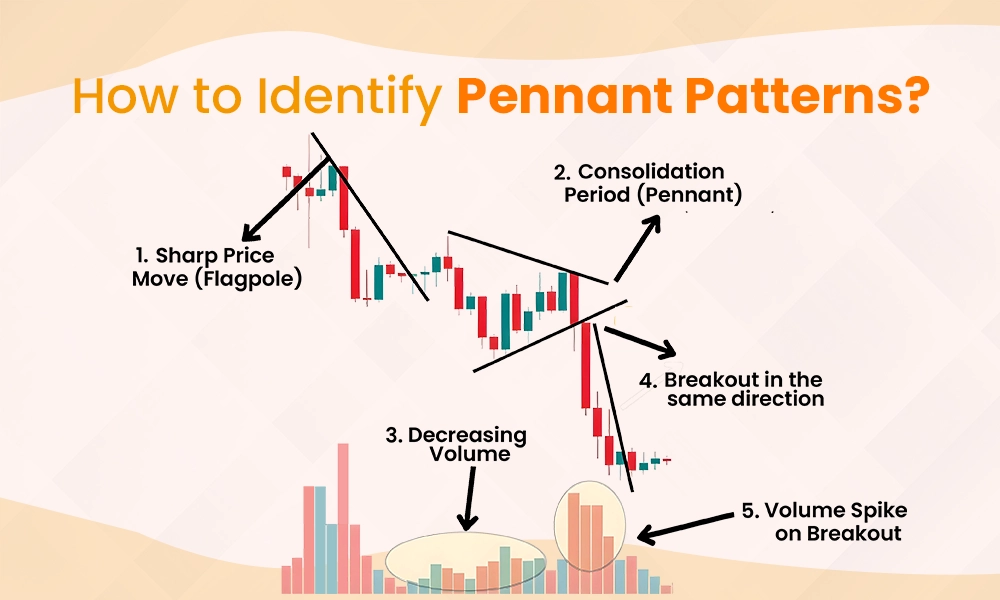
The first characteristic of a pennant pattern is a strong and sharp price movement in either direction—upward for a bullish pennant or downward for a bearish pennant. This forms the ‘flagpole’ and shows that buyers or sellers have taken control of the market.
After the sharp move, the price enters a consolidation phase. During this time, the price moves within a narrow range, creating a small triangular shape. Traders will see the price forming higher lows and lower highs, which is the key characteristic of the pennant.
As the consolidation forms, trading volume typically decreases. This indicates that the market is ‘taking a breather’ before making its next big move. The low volume during this stage is a signal to traders that a breakout could be coming.
The pattern is complete when the price breaks out of the triangular consolidation. In most cases, the breakout will occur in the same direction as the original move (up for a bullish pennant, down for a bearish pennant). Traders often enter trades after confirming the breakout.
A key characteristic to confirm the breakout is a sudden increase in trading volume. When the price moves out of the pennant, a spike in volume suggests strong buying or selling pressure, giving traders confidence that the trend will continue.
The two essential types of pennant patterns are bullish pennant patterns and bearish pennant patterns indicating the respective trends and market sentiment. These pennant patterns and the key to effectively trading them are explained below.
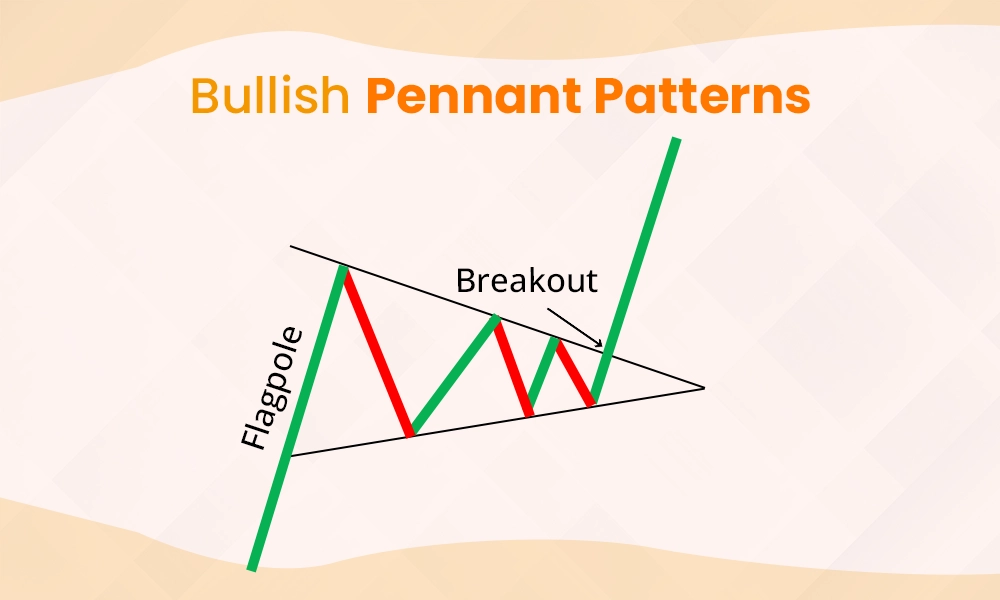
A bullish pennant forms after a sharp upward price move, followed by a period of consolidation where the price forms a small triangle. This pattern indicates that buyers are in control and the price is likely to continue rising after the consolidation. The bullish pennant is a continuation pattern, highlighting that the breakout usually happens in the same upward direction as the initial price surge.
Identify a strong upward move (the flagpole) followed by a triangular consolidation.
Wait for the price to break out above the resistance level of the pennant.
Enter a buy position after confirming the breakout with strong volume.
Set a stop-loss just below the pennant to protect against false breakouts.
Aim for a price target by measuring the length of the flagpole and adding it to the breakout point.
Bearish Pennant Pattern
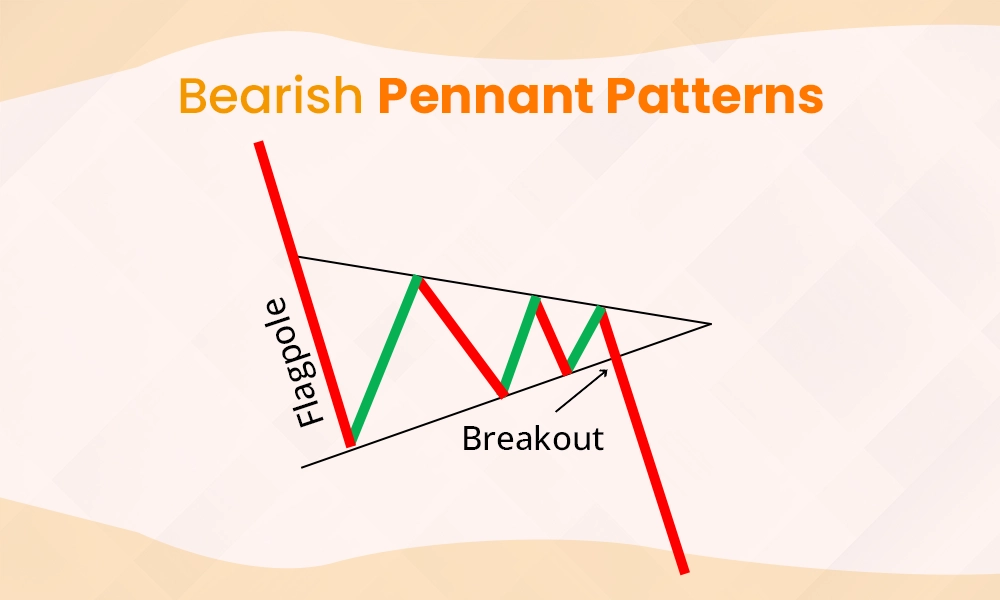
A bearish pennant forms after a sharp downward price move, followed by a consolidation period where the price forms a triangular pattern. This pattern suggests that sellers are dominant, and the price is likely to continue falling once the consolidation phase ends. Like the bullish pennant, it is a continuation pattern that leads to a breakout in the same direction as the initial downward move.
Identify a strong downward move (the flagpole) followed by consolidation in a triangular shape.
Wait for the price to break below the support level of the pennant.
Enter a sell position after confirming the breakout with increased volume.
Set a stop-loss above the pennant to guard against false breakouts.
Target the potential price move by measuring the flagpole and subtracting it from the breakout point.
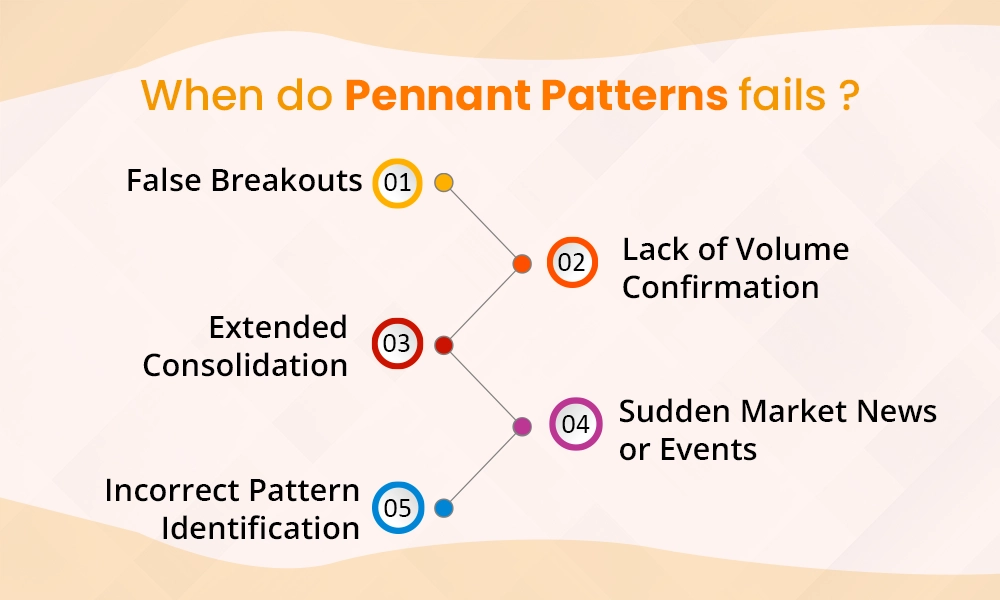
We have explained the steps and pointers to identify and trade using the pennant patterns, However, there may be cases where the traders fail to identify these patterns correctly and the positions taken may turn adverse. Some of the classic scenarios where the pennant pattern can fail to deliver are explained hereunder.
False Breakouts - A pennant pattern can fail when the price breaks out of the consolidation range, but quickly reverses in the opposite direction. This is called a false breakout and can trap traders who enter too early. False breakouts may happen due to low trading volume or sudden changes in market sentiment, leading to the pattern not playing out as expected.
Lack of Volume Confirmation - A crucial sign of a successful breakout is a noticeable increase in trading volume. If the price breaks out of the pennant but the volume remains low, it indicates weak momentum. In such cases, the breakout may fail, and the price could fall back into the consolidation range, leading to losses for traders who acted too soon.
Extended Consolidation - Cases where the price consolidates within the pennant for too long (far beyond the typical time frame) without breaking out can make the pattern seem less reliable. This can indicate indecision in the market, making the pennant pattern less likely to lead to a strong move.
Sudden Market News or Events - Pennant patterns can also fail due to unexpected market news or events that cause abrupt changes in price direction. Major news like earnings reports, economic data, or global events can override the technical signals from a pennant pattern, causing the price to move in an unpredictable direction, regardless of the pattern.
Incorrect Pattern Identification - Traders may sometimes confuse a pennant pattern with other similar patterns like wedges or triangles. Misidentifying the pattern can lead to incorrect trading decisions. For example, entering a trade too early or misinterpreting the breakout direction can result in losses if the pattern doesn’t behave as expected. Therefore, it is crucial to confirm the pennant patterns with corresponding indicators like moving averages, MACD (Moving Average Convergence Divergence), RSI (Relative Strength Indicator), Volume Indicator, etc.
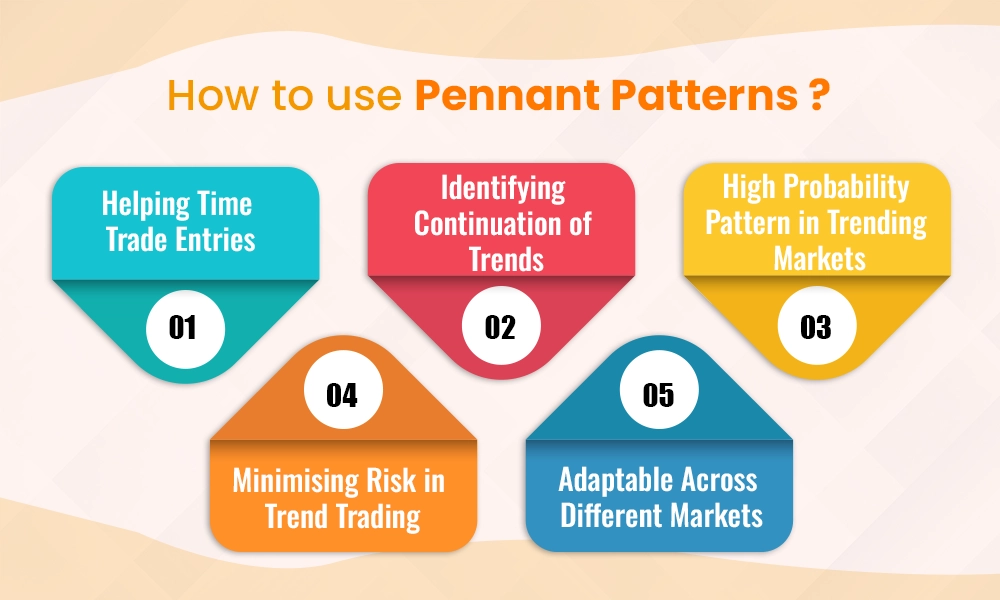
Traders can use pennant patterns in the following manner,
Pennant patterns provide excellent timing for trade entries. Since they occur during the consolidation phase of a strong trend, traders can use the pattern to anticipate when the price is likely to break out and continue moving in the same direction. This allows them to enter the trade right after the breakout, capturing a larger part of the price movement. The consolidation phase also allows traders to observe price behaviour, offering a clearer opportunity to buy or sell at the right moment.
Pennant patterns are key tools for traders as they indicate a continuation of an existing trend. After a sharp price movement, either upward or downward, a pennant pattern forms, showing a brief consolidation period. This pattern helps traders understand that the price pause is temporary and the market is likely to resume moving in the same direction once the consolidation ends. By identifying this, traders can plan their trades in line with the trend, avoiding the risk of betting against the market's momentum.
Pennant patterns are considered reliable in strongly trending markets, offering a higher probability of success when compared to other chart patterns. This is because they appear after a sharp price move, signalling that the trend has solid momentum. Traders looking for patterns with a strong likelihood of working out can rely on pennant patterns for more predictable outcomes, especially when trading stocks, forex, or cryptocurrencies.
One of the biggest challenges for traders is managing risk, especially during volatile markets. Pennant patterns help reduce this risk by providing clearer signals for entry and exit points. Traders can place stop-loss orders just outside the pennant pattern’s boundaries, below the support level for bullish pennants and above the resistance level for bearish pennants. This way, if the breakout does not happen as expected, traders can exit the trade with minimal loss, while still being positioned for gains if the trend continues.
Pennant patterns are not restricted to any specific asset class, making them versatile tools for traders. Whether trading in equities, commodities, forex, or cryptocurrencies, pennant patterns work across different timeframes and markets. This flexibility allows traders to apply the same strategy to various instruments, enhancing their trading approach by consistently recognising reliable patterns in diverse markets.
A step further to understand pennant patterns is learning about the pros and cons of pennant patterns. Here is a brief list of the same.
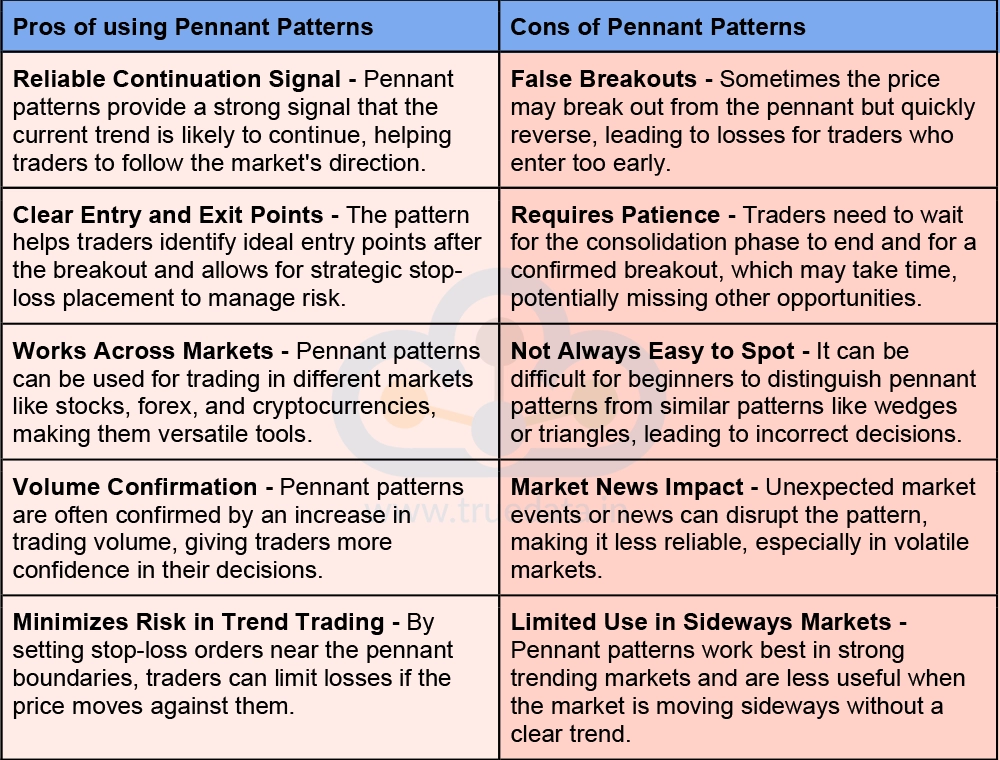
Pennant patterns are valuable tools for traders as it helps to identify the continuation of trends during strong market movements. They offer clear entry and exit points, reduce risk through strategic stop-loss placement, and can be used across different markets like stocks, forex, and cryptocurrencies. However, traders must be cautious of false breakouts, wait patiently for confirmation, and ensure they correctly identify the pattern. While pennant patterns are reliable in trending markets, they may be less useful in sideways or volatile markets affected by news events.
This article talks about pennant patterns in detail and how to use them to create a robust portfolio. Let us know if you have any queries related to this pattern or need further information and we will address it.
Till then Happy Reading!
Read More: Importance of Cumulative Volume Delta (CVD) and Volume Delta (VD) on 1min 5min and 15min Bars
Candlestick patterns are among the most basic and common tools traders use to cr...
Stock markets have been under a lot of pressure in the past week and investors ...
The use of technical analysis for trading is vital for creating a successful tr...