What is the key to a successful trading portfolio? One of the most common answers to this question is identifying the current trend or a potential trend reversal and taking suitable trading positions to minimise losses and maximise profits. Traders use a variety of technical analysis tools like candlestick patterns, charts, indicators, etc. to achieve this goal. While some charts or candlestick patterns can be difficult to identify and implement, one of the easier ones is the double top and double bottom pattern. Check out this blog to learn more about this pattern and how to identify it or trade using this pattern.
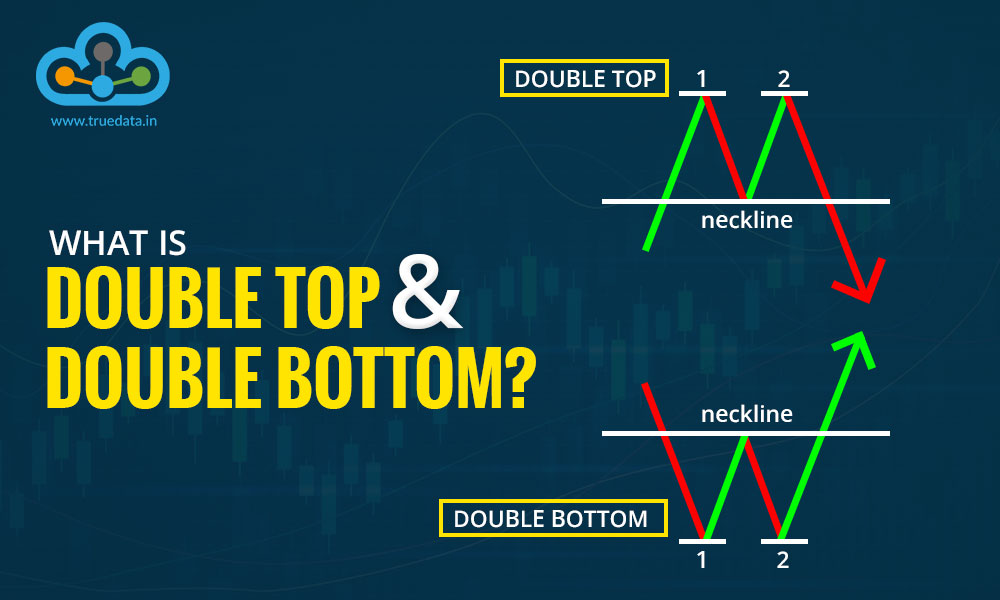
A double top pattern, also known as the bearish double top, signifies a potential trend reversal from the existing or prevailing bullish trend to a bearish one. This pattern is recognised by two peaks which are also referred to as twin peaks. These peaks are formed at approximately similar price levels and are connected by a valley also known as a neckline. Together they form the ‘M’ shape on the price chart signalling the trend reversal for the traders. This pattern suggests that after the price reaches its second peak, it is likely to reverse course and continue falling unless there is a new trend reversal.
The double bottom pattern similar to the double top is also a trend reversal pattern. This pattern in stark contrast to the double top pattern is also known as the bullish double bottom and signals the shift from a bearish trend to a bullish trend. Under this pattern, the price falls below the resistance level at two low points forming the two peaks which are connected through a neckline. The ultimate ‘W’ shape formed by the three price points confirms the upcoming bullish trend when prices rise above the neckline and continue the increase.
The double top and the double bottom patterns are among the easier-to-identify patterns and therefore are quite popular trading patterns, especially among the beginners in the trading arena. Here is a quick snapshot of how to identify and confirm the prevalence of these patterns and create a trading portfolio.
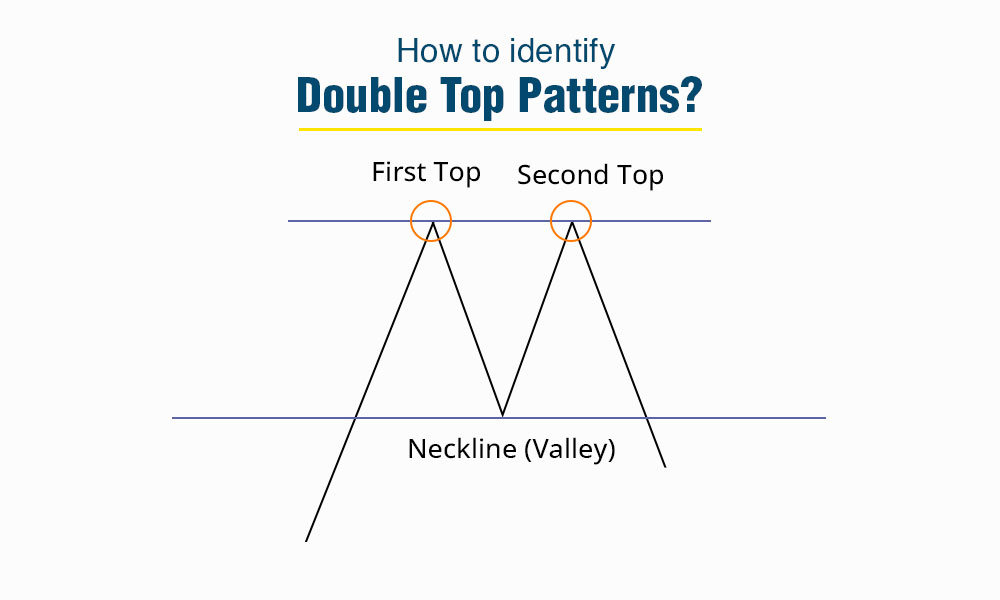
The steps to identify a double top pattern are,
The first step is to look for two peaks of similar height formed on the price chart, creating an ‘M’ shape.
These two peaks should be separated by a valley to form a neckline.
The neckline acts as a support level to connect the lows between the two peaks.
The next step is to confirm the pattern when the price falls below the neckline after the second peak.
This breach of the neckline signals a potential trend reversal from bullish to bearish.
Traders often use volume analysis to confirm the validity of this pattern along with other technical analysis indicators.
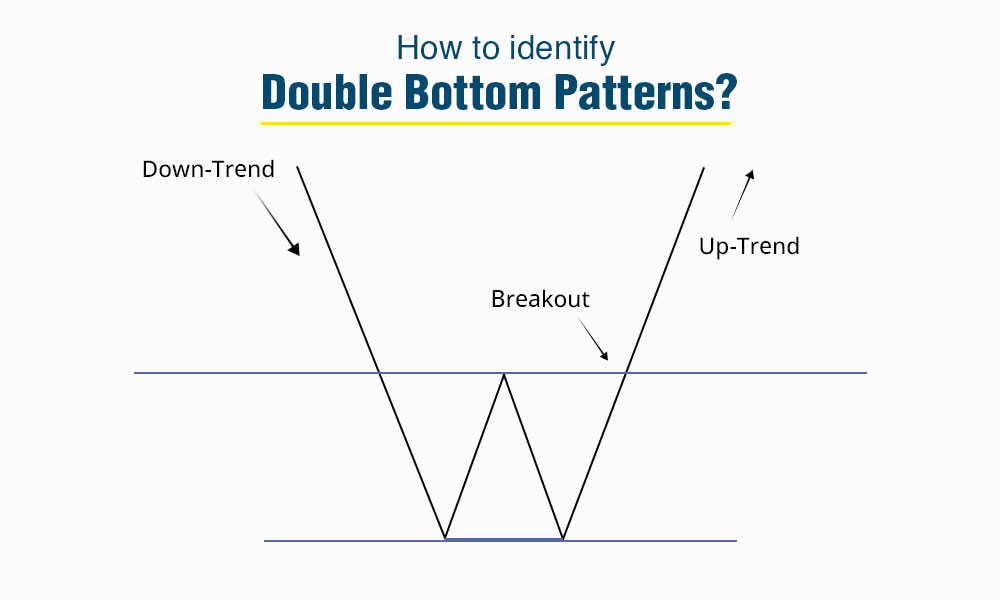
The steps to identify the double bottom pattern are,
The first step is to search for two bottom peaks or lowest prices of approximately the same depth on the price chart that form the ‘W’ shape.
The two bottoms should be separated by a peak to form a neckline.
This neckline acts as a resistance level, connecting the highs between the two bottoms.
Following this, the next step is to confirm the pattern when the price rises above the neckline after the second bottom.
This breakout above the neckline indicates a potential trend reversal from bearish to bullish.
Similar to the double top pattern, volume analysis is used in this pattern as well to validate the strength of the pattern along with other technical analysis indicators supporting the trend reversal.
We have seen the steps for identifying the double top and double bottom pattern above. Now let us focus on how to trade using these patterns. This includes risk management, profit reach, and more. Here is a brief analysis of trading using the double-top and double-bottom patterns.
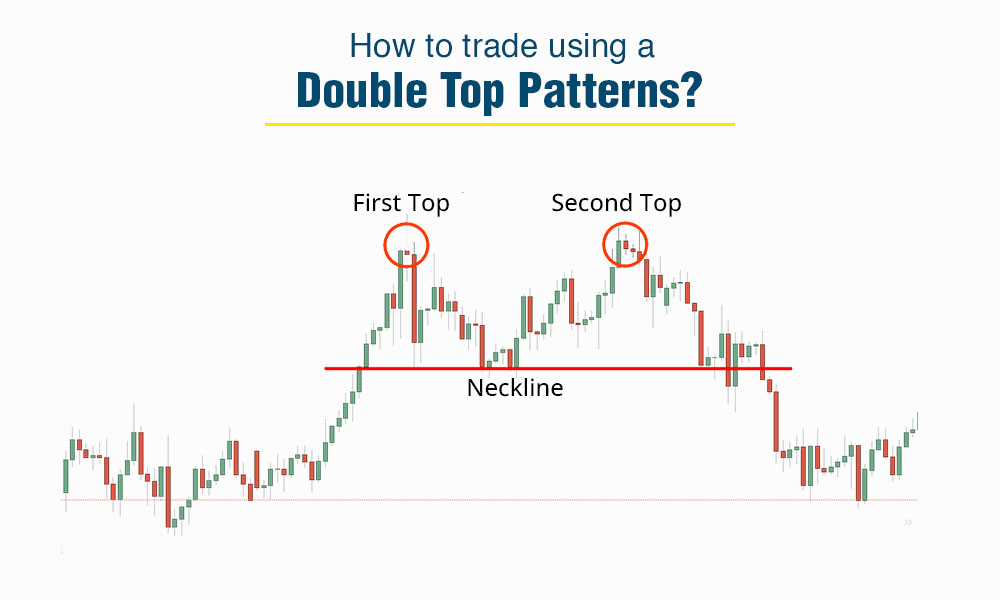
The steps to trade using the double top pattern can be explained as under.
Identification - The first step to trade using any pattern is to recognise it in its entirety. Traders should first and foremost recognise this pattern with the formation of two peaks at similar price levels that form an ‘M’ shape on the chart and have a valley (neckline) in between.
Entry Point - Traders should then enter a short trade when the price breaks below the neckline after the second peak thereby confirming the pattern.
Stop Loss Placement - A stop-loss order should be set above the second peak or the recent swing high to limit potential losses if the price reverses or the trend is not supported by enough volumes.
Profit Target - Traders should target a profit level based on the depth of the pattern which is typically done by measuring the distance from the peak to the neckline and projecting it downward from the breakout point.
Risk Management - Risk management is essential in any trade and traders need to manage their risk while trading this pattern by ensuring the potential reward outweighs the risk. This is done by using proper position sizing and stop-loss orders or trailing stop-loss orders.
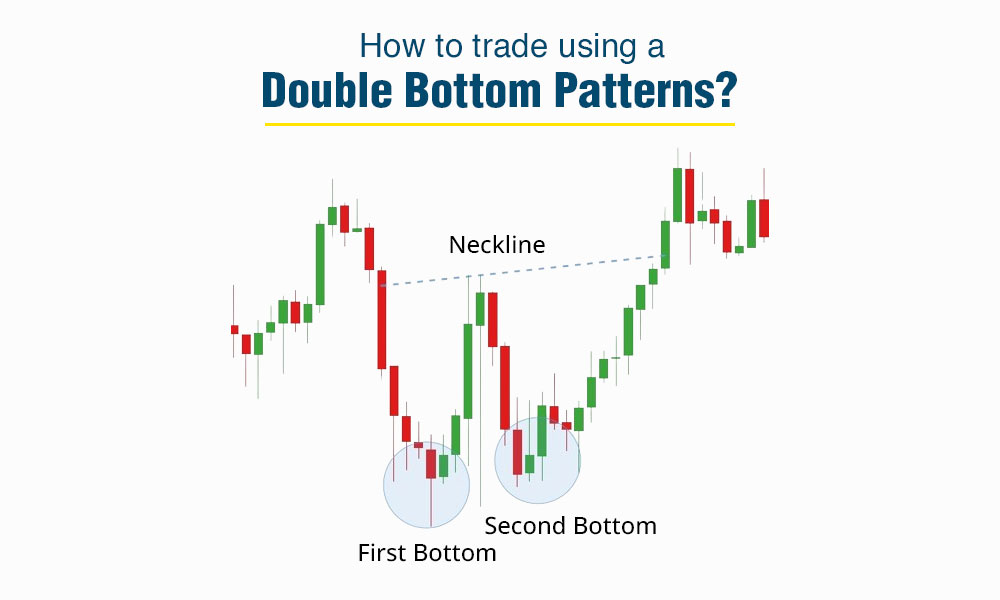
The steps to trade using the double bottom pattern can be explained as under.
Identification - Similar to the double top pattern, the first step in this case is also to identify the pattern correctly. Traders need to identify the formation of two bottoms at similar price levels that form a ‘W’ shape on the chart with a peak (neckline) in between.
Entry Point - After correctly identifying the pattern, traders should enter a long trade when the price breaks above the neckline after the second bottom thereby confirming the pattern.
Stop Loss Placement - A stop-loss order should be placed below the second bottom or the recent swing low to manage potential losses in case of a reversal.
Profit Target - Determine a profit target based on the pattern's depth, often measuring the distance from the neckline to the lowest point of the "W" shape and projecting it upward from the breakout point.
Risk Management - Employ risk management strategies such as proper position sizing, trailing stops, and adhering to a risk-reward ratio.
The double top and double bottom chart pattern is an easy-to-spot and easy-to-understand pattern making it quite popular among traders. However, it is important to remember that this pattern should not be used in isolation to interpret trends or potential trend reversals. Traders should back their interpretation with other technical indicators and volume analysis to ensure a successful trading portfolio.
This article provides a brief analysis of the double top double bottom pattern and how it can be used to trade. Let us know if you need further details on this topic or have any queries that we can address.
Till then Happy Reading!
Read More: Utilize Real-time Market Data Effectively for Trading Decisions

Candlestick patterns are among the most basic and common tools traders use to cr...
Stock markets have been under a lot of pressure in the past week and investors ...

The use of technical analysis for trading is vital for creating a successful tr...