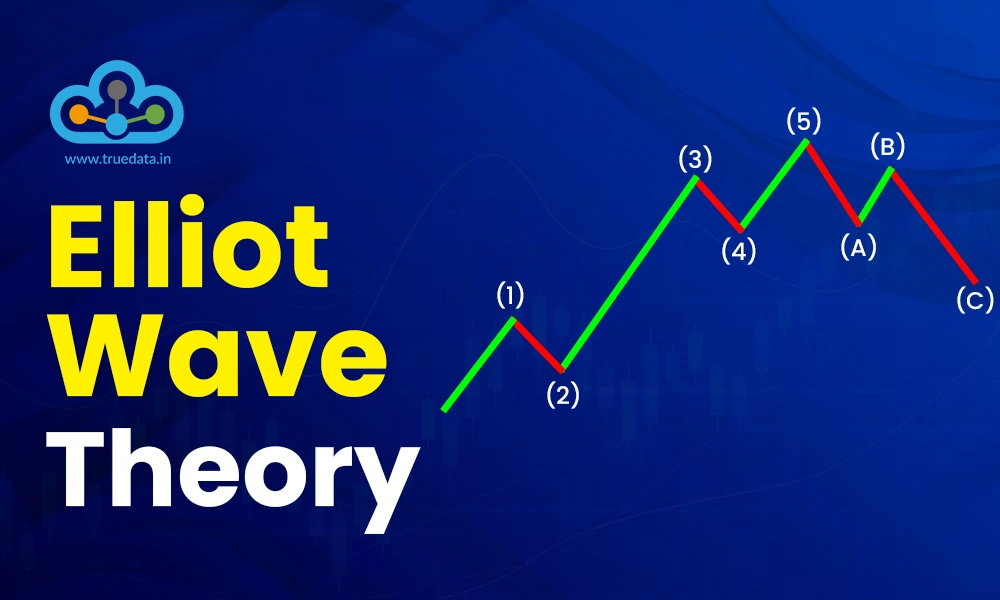
The primary step for any investor or trader to participate in stock markets is to analyse the price movements. For an average trader or an investor, the price movements usually appear to move in waves. The highs and lows of the stock price create perfect windows of opportunities to enter or exit the market and ensure profitable positions. Based on this concept of waves in price movements there is an important concept of technical analysis called Elliot Waves Theory. Have you heard about this theory? Check out this blog to know all the details about this theory and how to use it for successful trading.
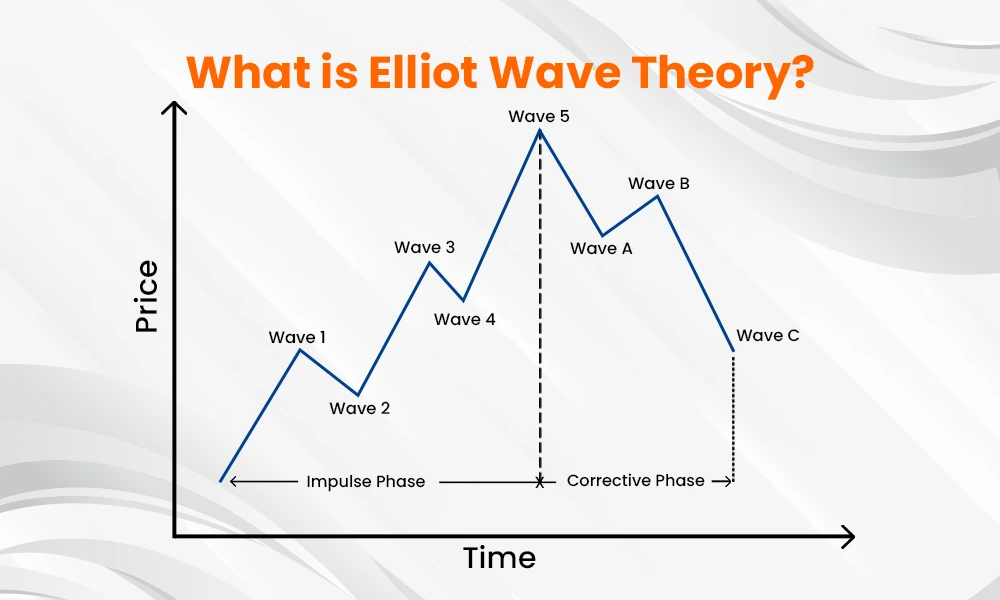
Elliott Wave Theory, developed by Ralph Nelson Elliott in the 1930s, is a tool that helps traders and investors predict market movements based on recurring price patterns. Elliott observed that market prices follow a natural rhythm, influenced by collective investor psychology. He found that in a typical trend, prices move in five waves in the trend's `direction, followed by three corrective waves in the opposite direction. This theory, inspired by patterns like the Fibonacci sequence, suggests that if traders can identify the current wave within a cycle, they can make better predictions about where prices are likely to go next thereby enabling informed decisions for a profitable portfolio. This theory is versatile and used across different markets, including stocks, commodity markets, and indices like Nifty and Sensex, to spot trading opportunities and manage risks.
The Elliott Wave Theory helps predict market trends thereby aiding in trend trading by identifying recurring price patterns that reflect investor psychology, such as optimism, fear, and greed. According to the theory, markets move in two types of waves, i.e., Impulse Waves and Corrective Waves. Impulse Waves consist of 5 smaller waves and move in the direction of the main trend, while Corrective Waves consist of 3 smaller waves and move against the trend. This wave pattern is believed to repeat over time, allowing traders to understand market behaviour and predict future price movements. However, these primary waves can further be broken down for a deeper understanding of market movements for market participants. Here is a detailed explanation of the various types of waves under the Elliot Wave Theory.
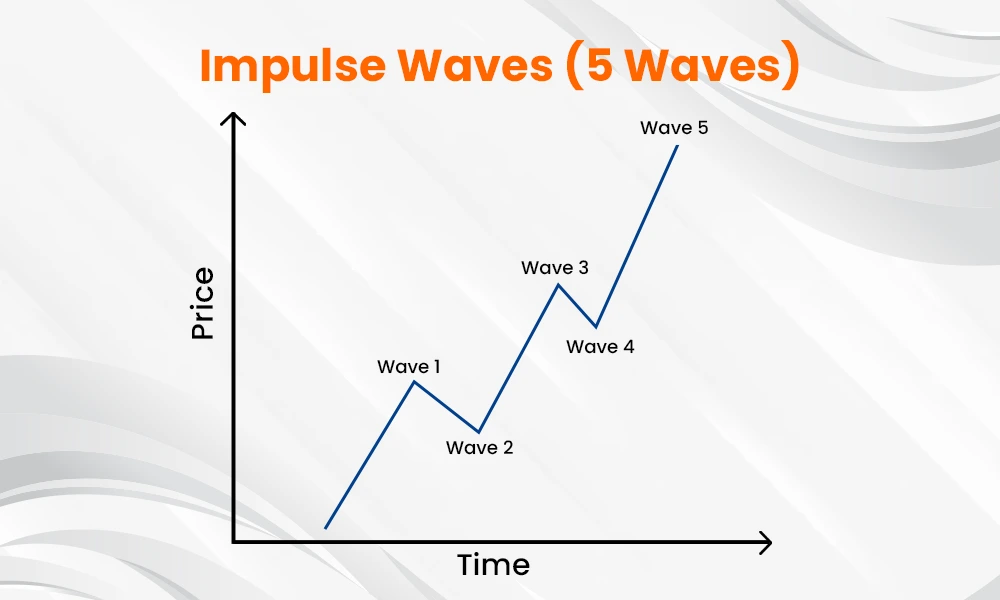
The impulse waves are the core of Elliott Wave Theory and move in the direction of the main trend, whether it is upward (bullish) or downward (bearish). Impulse waves consist of five distinct waves as explained hereunder.
This is the start of a new trend (either up or down).
In an uptrend, it is the initial rise when some savvy investors sense an opportunity.
In a downtrend, it signals the first decline when the market starts losing steam.
This is a corrective move that goes against the primary trend.
In an uptrend, this is usually when the market pulls back slightly as some traders take profits, but the sentiment remains largely positive.
The most powerful and usually the longest wave.
In an uptrend, this is when broader market participants jump in, causing a strong price rally, while in a downtrend, it represents the largest decline as fear grips the market.
This wave is often driven by major news, economic reports, or overall market sentiment.
This is another corrective wave, however, it is less intense than Wave 2.
In an uptrend, it represents a minor pullback before the final upward push as the market takes a breather.
In a downtrend, it is represented by a small rebound or retracement before the final drop.
This is the final push in the direction of the trend.
In an uptrend, this is usually driven by overconfidence or irrational exuberance, where less informed traders jump in, thinking the rally will continue forever.
In a downtrend, it represents the last phase of panic selling before the market starts to stabilise.
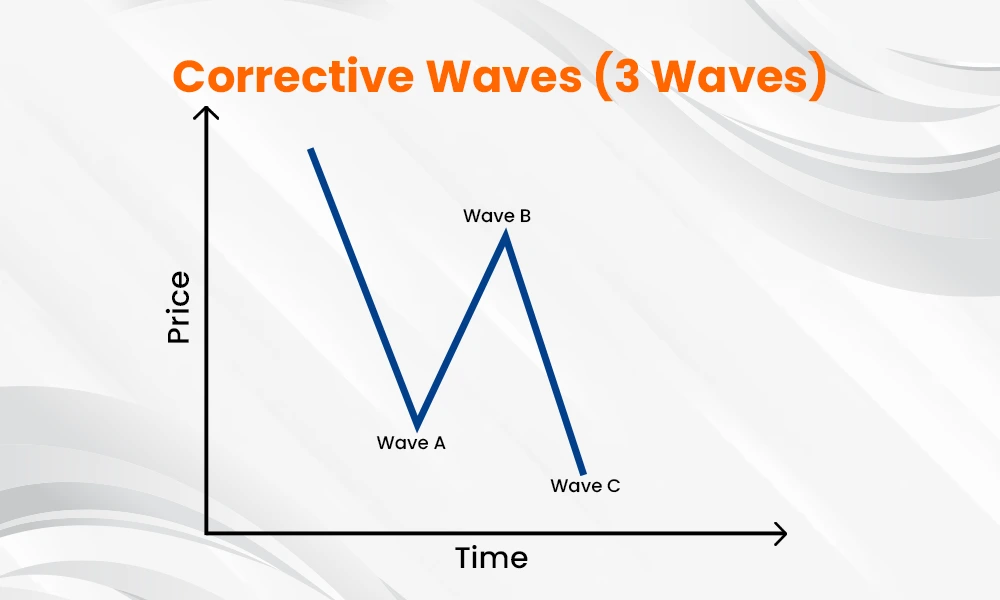
Once the impulse wave is completed, the market goes through a corrective phase, which consists of three waves (A, B, and C). This phase moves against the primary trend and corrects the gains or losses of the previous trend. These waves are explained hereunder.
In an uptrend, this is the first sign of weakness or a pullback.
In a downtrend, it shows the initial recovery or relief rally after the main decline.
This is often a partial reversal of Wave A.
In an uptrend, this occurs when the market might briefly regain strength but usually lacks momentum to reach new highs.
In a downtrend, this wave occurs when the market attempts to fall again but it does not go to new lows.
This is the final wave of correction and is often equal in size to Wave A.
In an uptrend, this wave marks a more significant pullback before the next trend resumes.
In a downtrend, this wave is the last rebound before the next move down.
Corrective waves help markets take a ‘breather’ after a big move. They are crucial because they allow traders to re-enter the market at better prices after a trend has been established.
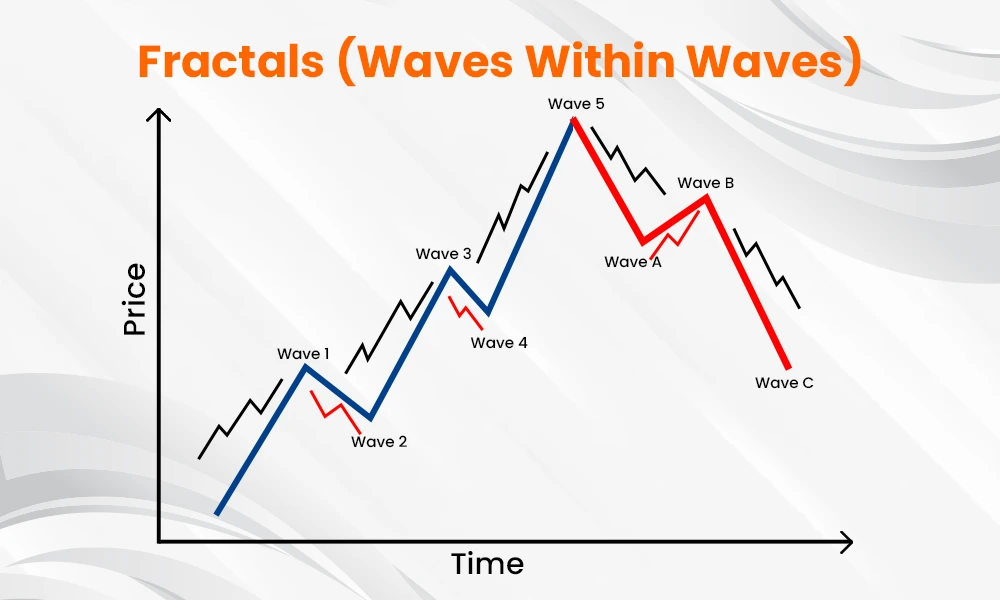
A key concept of Elliott Wave Theory is that waves are fractal which implies that the same patterns occur in all time frames i.e., from intraday trading charts to long-term charts. Whether traders are looking at a 5-minute chart or a monthly chart, they will see the same 5-wave impulse followed by a 3-wave correction. This fractal nature makes Elliott Wave Theory flexible for both day traders and long-term investors.
The waves can be used to time short-term entry and exit points, whether for trading stocks like Reliance, indices like the Nifty 50, or commodities like gold.
Understanding the broader wave pattern can help traders and investors ride bigger trends in the market. For example, tracking and understanding the long-term growth of the Sensex or other major stocks.
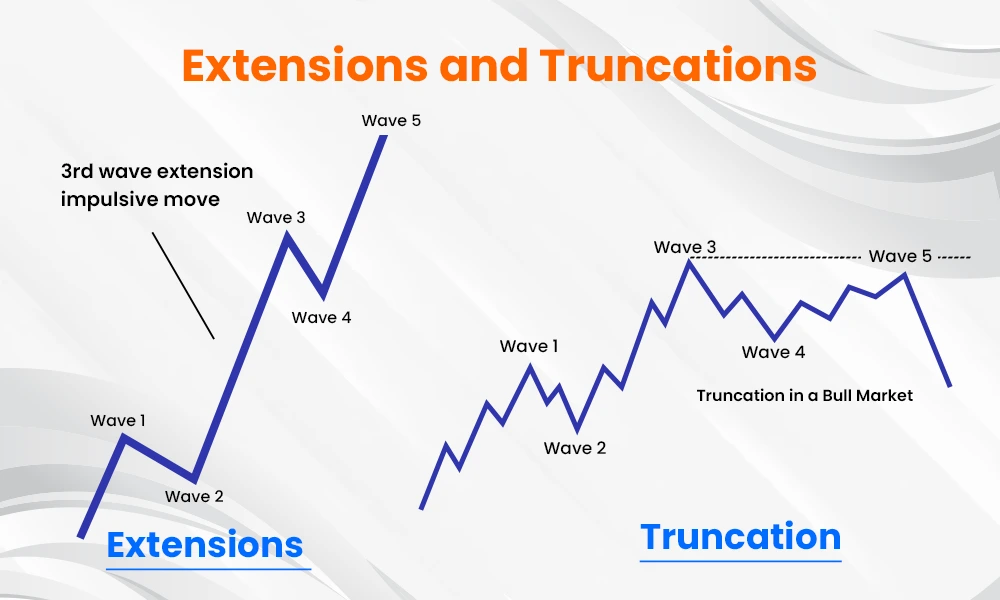
In Elliott Wave Theory, sometimes one of the impulse waves is extended which makes it much longer than the others. This typically happens in Wave 3, which is known for being the most powerful wave in a trend.
On the other hand, a wave might become truncated or shortened which means it falls short of expectations. For example, Wave 5 might not reach as high as Wave 3 in an uptrend, indicating the market is running out of steam.
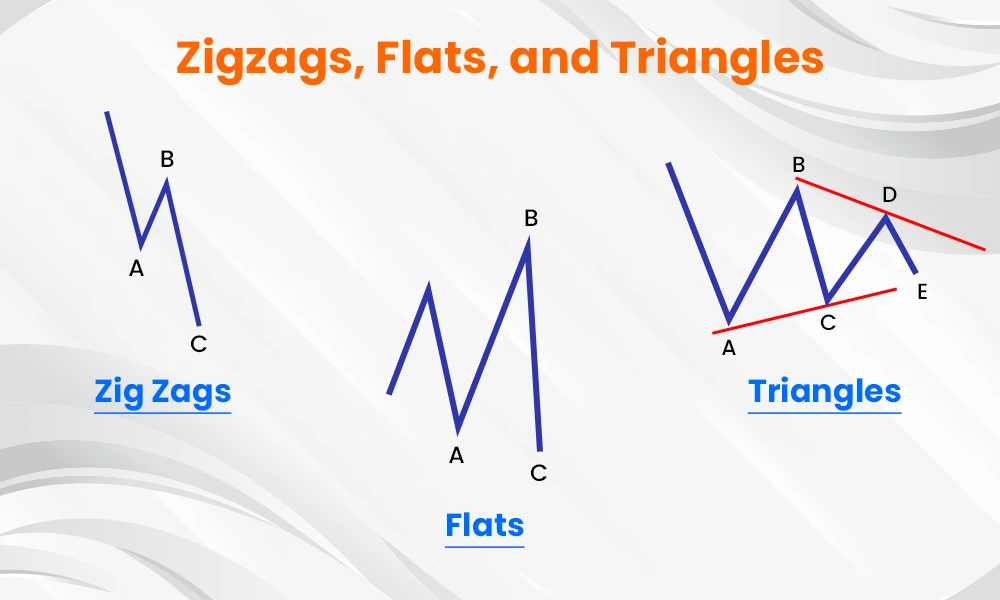
There are different patterns like zigzags, flats, and triangles within corrective waves. These are various ways the market corrects itself after a strong move. These shorter patterns are highlighted below.
Zigzag - This pattern is a sharp corrections that form a steep A-B-C pattern.
Flat - This pattern is a more sideways correction, where the A and B waves are roughly equal.
Triangle - This pattern represents a series of converging price swings, usually happening in Wave 4, before the final impulse wave.
Understanding these patterns helps traders anticipate how long the market might remain in correction mode before the trend resumes.
While the primary waves in the Elliot Wave Theory are explained above, the theory can also be used to look at the market cycle at a grander scale that can span centuries to the minutest scale of minutes. Here is a brief description of the same.
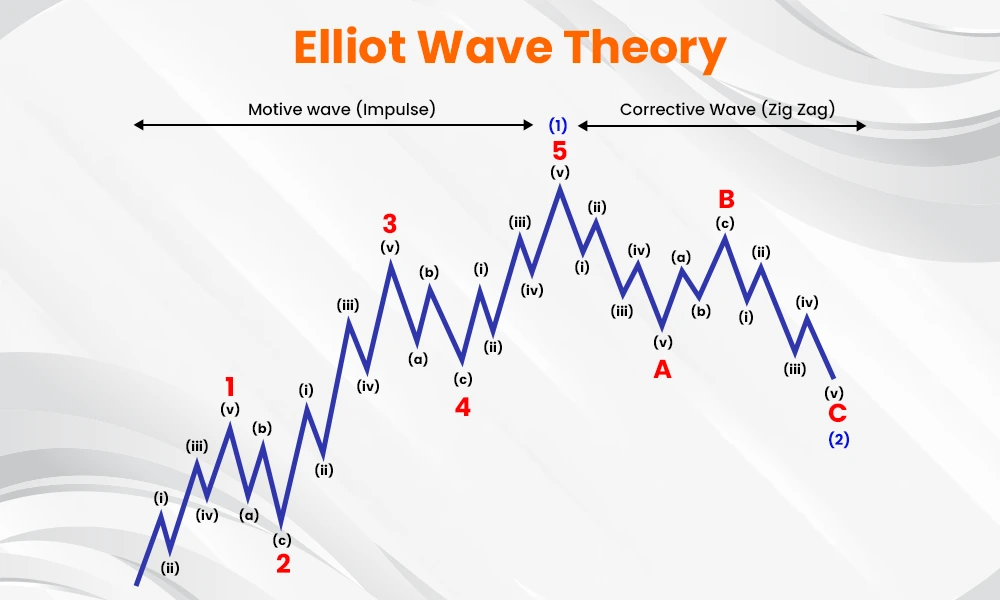
Grand Super Cycle
Symbols - ((I)) ((II)) ((III)) ((IV)) ((V)) ((a)) ((b)) ((c)) ((w)) ((x)) ((y))
Description - This is the largest and longest-term wave level, spanning centuries. It captures major economic and social trends that unfold over generations, reflecting historical cycles of economic expansion and contraction.
Super Cycle
Symbols - (I) (II) (III) (IV) (V) (a) (b) (c) (w) (x) (y)
Description - Super Cycle waves last several decades (typically 40-70 years) and represent significant economic eras, like long-term bull or bear markets. This level is important for understanding multi-decade trends in stock markets.
Cycle
Symbols - I II III IV V a b c w x y
Description - Cycle waves span a few years to several decades. This level can be seen in long-term bull and bear markets that affect major indices like the Nifty 50, covering broad economic shifts.
Primary
Symbols - ((1)) ((2)) ((3)) ((4)) ((5)) ((A)) ((B)) ((C)) ((W)) ((X)) ((Y))
Description - Primary waves typically last several months to a couple of years. They represent medium-term trends within a Cycle wave and are useful for identifying multi-month trading opportunities in indices or large-cap stocks.
Intermediate
Symbols - (1) (2) (3) (4) (5) (A) (B) (C) (W) (X) (Y)
Description - Intermediate waves span a few weeks to several months, showing trends within Primary waves. These are helpful for shorter-term trading, as they capture the intermediate trends in the market.
Minor
Symbols - 1 2 3 4 5 A B C W X Y
Description - Minor waves last from a few weeks to a few days, representing smaller trends within Intermediate waves. They are often used in swing trading by traders looking for moves within weeks or days.
Minute
Symbols - ((i)) ((ii)) ((iii)) ((iv)) ((v)) ((a)) ((b)) ((c)) ((w)) ((x)) ((y))
Description - Minute waves last a few days to several hours, capturing even smaller trends within Minor waves. Traders can use this level for short-term trading opportunities, often helpful in highly active stocks or indices.
Minuette
Symbols - (i) (ii) (iii) (iv) (v) (a) (b) (c) (w) (x) (y)
Description - Minuette waves span hours to minutes, representing very short-term moves within Minute waves. These are ideal for intraday traders who look to capitalize on brief price movements within a single trading day.
Subminuette
Symbols - i ii iii iv v a b c w x y
Description - Subminuette waves are the smallest, lasting minutes or even seconds. Scalpers and high-frequency traders may use this level to identify extremely short-term price changes.
Fibonacci Retracements are an important concept in technical analysis and can also be used in the Elliot Wave Theory to determine how far a price might retrace (pullback) after a significant move. This analysis is useful in forecasting potential turning points within Elliott waves.
Here is how Fibonacci Retracement ratios are applied to different waves.
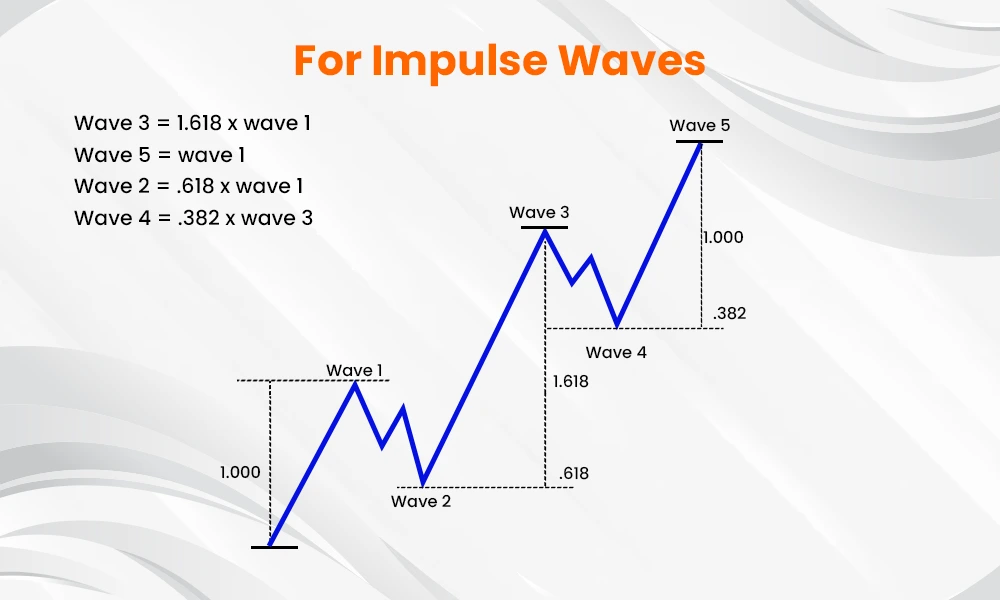
Wave 1 - As this is the start of a new trend and is often hard to identify, Fibonacci ratios are usually not used here. However, traders might use Fibonacci extensions to predict how far the wave could go if the trend is clear.
Wave 2 - After Wave 1, the market pulls back in this corrective wave where Wave 2 usually retraces 50%, 61.8%, or even 78.6% of Wave 1 but never 100%. Traders look for buying opportunities around these Fibonacci retracement levels.
Wave 3 - As this is often the strongest and longest wave in the trend, Fibonacci extensions can be used to measure its potential length. Wave 3 often reaches 161.8% of Wave 1, but it can go to 261.8% or 423.6%.
Wave 4 - This is another corrective wave similar to Wave 2 but also tends to be shallow. Wave 4 usually retraces 23.6% or 38.2% of Wave 3, rarely exceeding 50%. A shallow retracement indicates a strong trend, suggesting Wave 5 will follow.
Wave 5 - The final wave in the trend often reaches 61.8% or 100% of Wave 1. In strong markets, Wave 5 can extend to 161.8% of Wave 1.
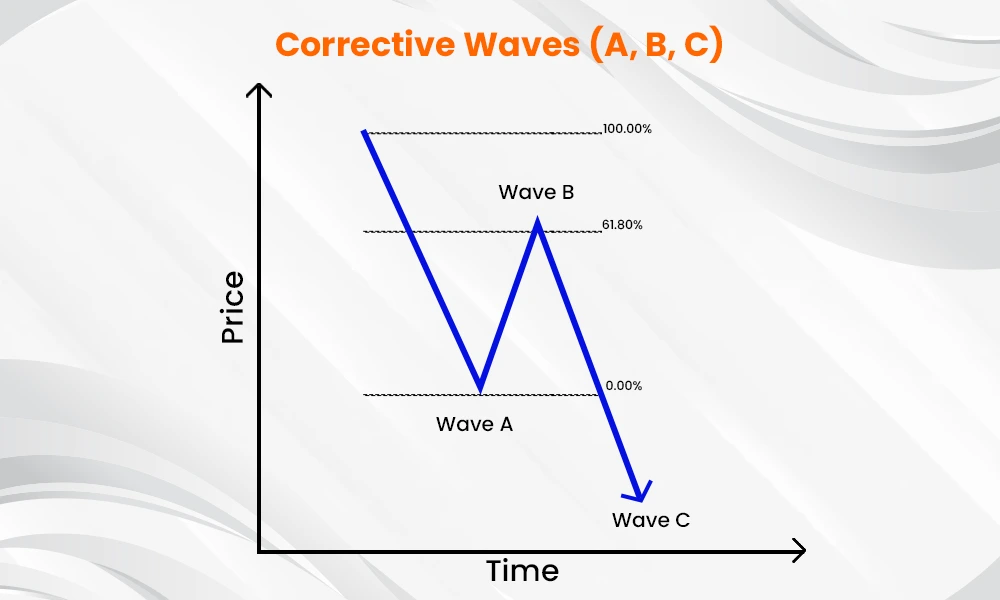
Wave A is the first move against the trend, where Fibonacci ratios are not typically used.
Wave B retraces Wave A, often hitting 50%, 61.8%, or sometimes 78.6% of Wave A.
Wave C, the final leg of the correction, is where Fibonacci extensions can predict it could go to 100% or 161.8% of Wave A.
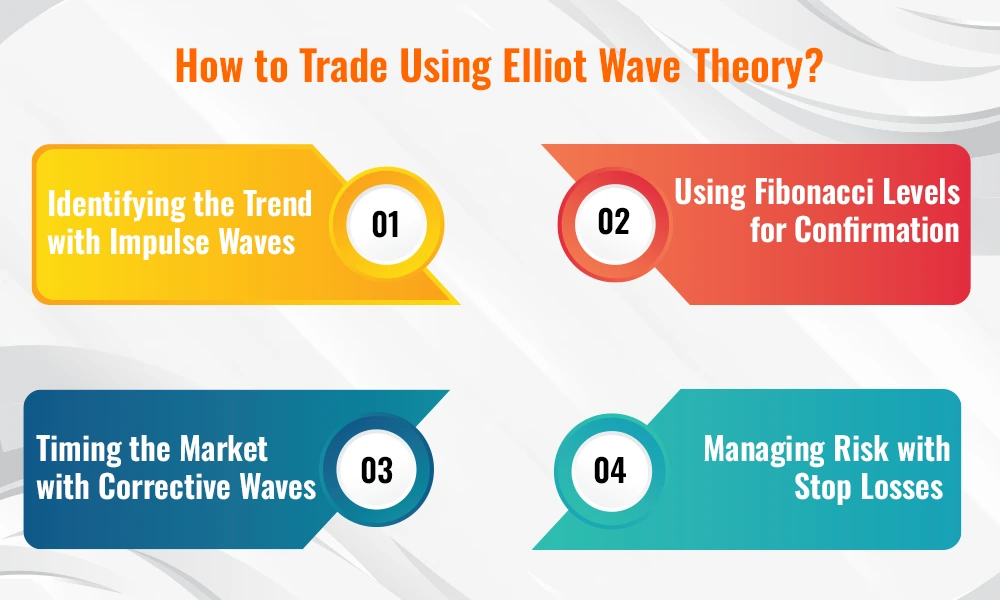
Now that we have learned the various aspects and waves of the Elliot Wave Theory, let us now focus on how to trade using this theory. Here are the steps or the points to be considered.
The first step in trading using Elliott Wave Theory is to identify the impulse wave pattern, which consists of five waves. Waves 1, 3, and 5 follow the trend, while Waves 2 and 4 are corrections. Traders should aim to enter the market during Wave 3 or Wave 5, which are strong movements in the direction of the trend. Spotting the early part of Wave 3 on charts like Nifty or Sensex can be a great entry opportunity for traders to maximise the profitability of the portfolio.
After an impulse wave, the market undergoes a corrective phase (A, B, C). During this time, prices often retrace and move against the main trend. Savvy traders can use this to their advantage by either exiting positions to lock in profits or entering at the end of Wave C, as the next impulse wave is likely to begin. Corrective waves offer great re-entry points for investors in blue-chip stocks like Tata Motors or Infosys.
Elliott Wave Theory is often combined with Fibonacci retracement levels to confirm potential price targets. For example, corrective waves often retrace to 38.2%, 50%, or 61.8% of the previous impulse wave’s length. Traders can use Fibonacci tools to spot where corrections might end, helping them time entries and exits in markets with more precision.
While trading with Elliott Wave Theory, it is essential to manage risk by placing stop-loss orders below or above critical support and resistance levels. For example, if traders are entering at the start of Wave 3, they can place a stop loss just below the end of Wave 2. This protects traders from sudden reversals in the market, especially in volatile stocks or indices.
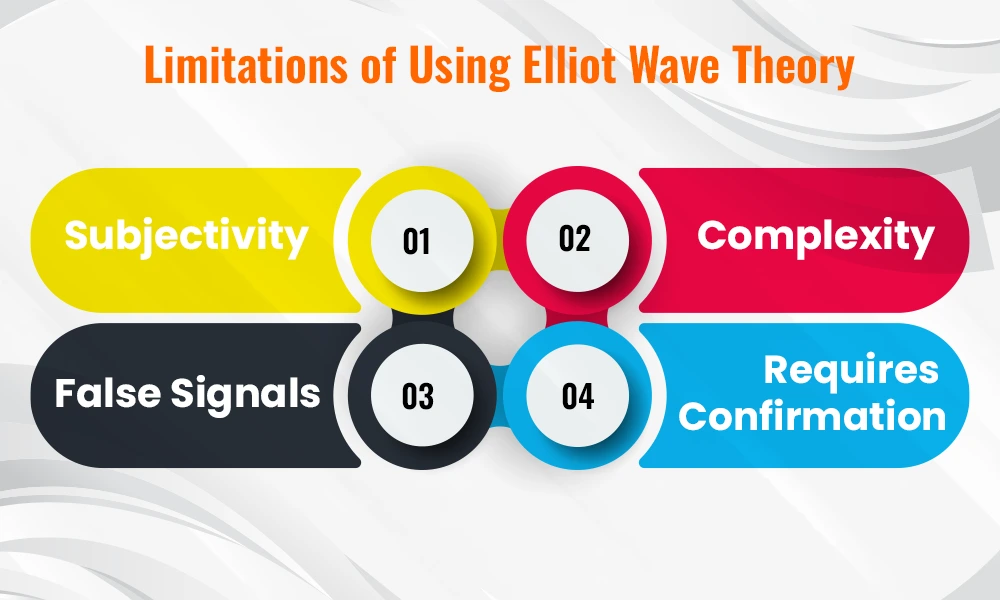
Although Elliot Wave Theory is a very popular concept of technical analysis that can be used in diverse assets as well as time frames, there are a few limitations in using this theory that should be considered as well. These limitations are highlighted below.
Subjectivity - The interpretation of wave patterns can be subjective, as different traders may identify different waves. This can lead to inconsistent predictions and trading decisions.
Complexity - The understanding and application of Elliott Wave Theory can be complex, especially for beginners. It requires practice and experience to accurately identify wave patterns.
False Signals - Elliott Wave Theory can generate false signals, where a wave pattern may appear to be forming but then fails to materialise. This can lead to losses if traders act on incorrect signals.
Requires Confirmation - Elliott Wave Theory is best used in conjunction with other technical analysis tools. Therefore, relying solely on wave patterns without confirmation from indicators or other analyses can increase risk for traders and lead to potential losses.
Elliott Wave Theory offers a robust framework for traders and investors to understand market movements and make informed decisions. It is more than just a way to spot patterns, rather it provides deeper insights into market psychology. This theory helps traders and investors to better time their trades and avoid getting caught in corrections or market reversals. Furthermore, combining Elliott Wave analysis with tools like Fibonacci retracement levels enhances the ability to predict price targets and manage risk effectively with stop-loss orders.
This article talks in detail about the Elliot Wave Theory and its use for successful trading. Let us know your thoughts on this topic or if you have any queries and we will address them.
Till then Happy Reading!
Read More: What is Dow Theory?
If you are a seasoned trader or abeginner in trading, one of the most pressing q...
NSE Stock Prices in Excel in Real Time - Microsoft Excel is a super software cap...

Introduction For the longest time, investment in stock markets was thought to b...