What is one of the deciding factors while investing in a stock? It is its valuation. If a stock is undervalued with strong fundamentals, it is a good catch and vice versa. But this was about one stock, how do you decide about the market as a whole whether it is overvalued or undervalued? This is where the Buffett indicator comes into play. It is one of the most popular indicators to gauge market sentiment and make informed decisions to enter or exit the market. Know all about this indicator and how to use it as an effective investment strategy in this blog and refine your stock market knowledge.
The Buffett Indicator is named after the legendary investor Warren Buffett and is also known as the ‘Market Cap to GDP ratio’. While there are multiple valuation tools or ratios for a stock (like EPS, PE ratio, PEG ratio, etc.), this indicator is widely used by investors and traders to assess if the market is fairly valued. This ratio takes into account two macro aspects for analysis of the market, namely, the total value of all companies listed on the stock market (market capitalisation) to the country's total economic output (GDP). This indicator helps investors understand whether the stock market, as a whole, is in a good position to invest or if it is time to be cautious.
The calculation of the Buffett indicator uses a straightforward formula. The formula is explained hereunder.
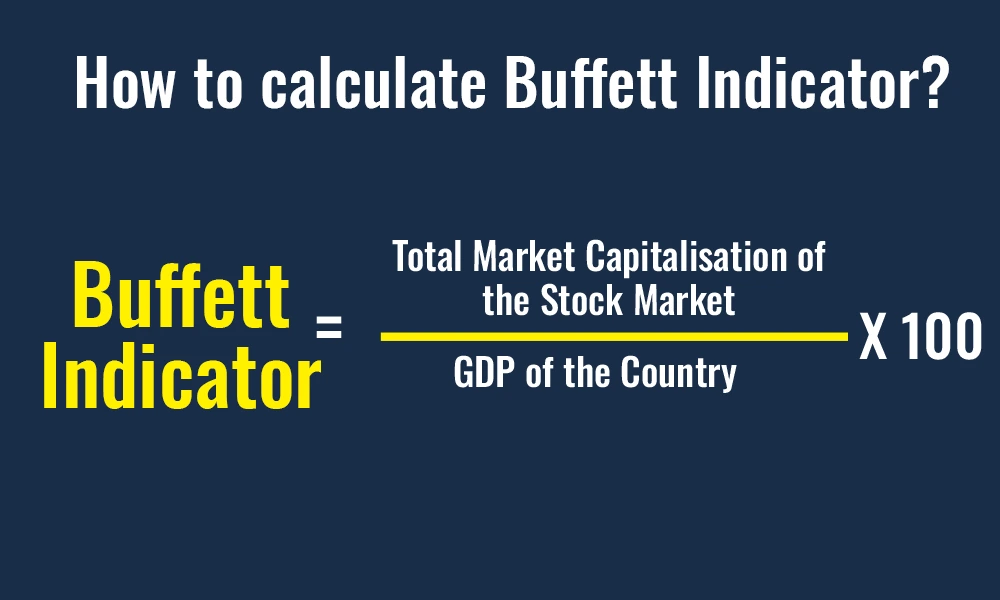
Buffett Indicator = (Total Market Capitalisation of the Stock Market / GDP of the Country) * 100
Breaking down the formula -
Total Market Capitalisation- This is the combined value of all the companies listed on the stock market. It’s calculated by multiplying the share price of each company by the total number of its shares and then adding up these values for all companies on the exchange. This would include companies listed on exchanges like the NSE (National Stock Exchange) and BSE (Bombay Stock Exchange) and investors can find this figure on the financial websites or stock market reports.
GDP (Gross Domestic Product) - This represents the total value of all goods and services produced within the country over a specific period, usually a year. The GDP figure is typically released by the Government or financial institutions like the Reserve Bank of India (RBI) and can be found in economic reports.
The resultant percentage tells whether the stock market is valued high or low relative to the country’s economic size.
Understanding the Buffett Indicator with an example
If the total market capitalisation of the Indian stock market is Rs. 200 trillion and India’s GDP is Rs. 150 trillion, then the Buffett indicator will be calculated as under.
Buffett Indicator = (200/150) *100 = 133.33%
A Buffett Indicator of 100% means the market is valued exactly at the level of the GDP. If the indicator is significantly above 100%, it might suggest that the stock market is overvalued, and if it is below 100%, it could indicate the market is undervalued.
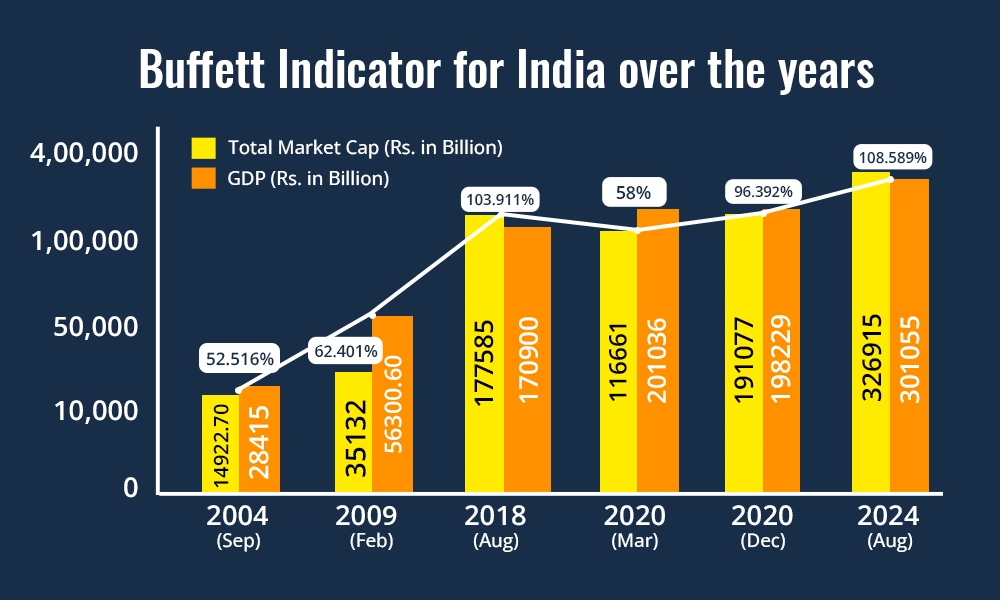
*Source - https://www.gurufocus.com/global-market-valuation.php?country=IND
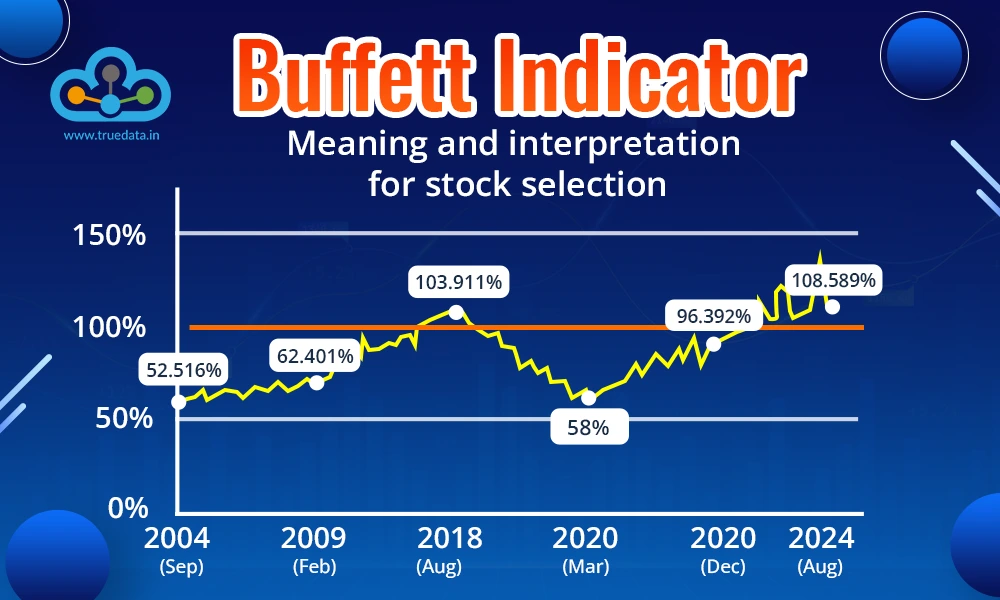
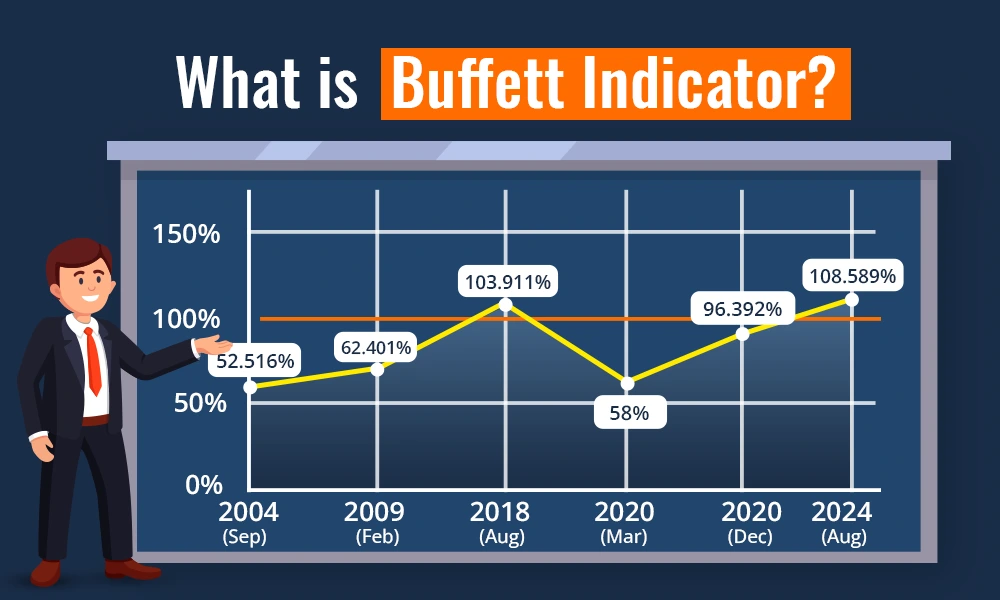
The current Buffett Indicator is 108.59% and as per this indicator, the stock market is currently Modestly Overvalued.
The Buffett Indicator helps investors assess whether the stock market is overvalued, undervalued, or fairly valued. This ratio or indicator helps investors get a broad sense of the market's valuation. It can, therefore, be a useful tool for deciding whether it is a good time to invest heavily, be cautious, or avoid the market altogether.
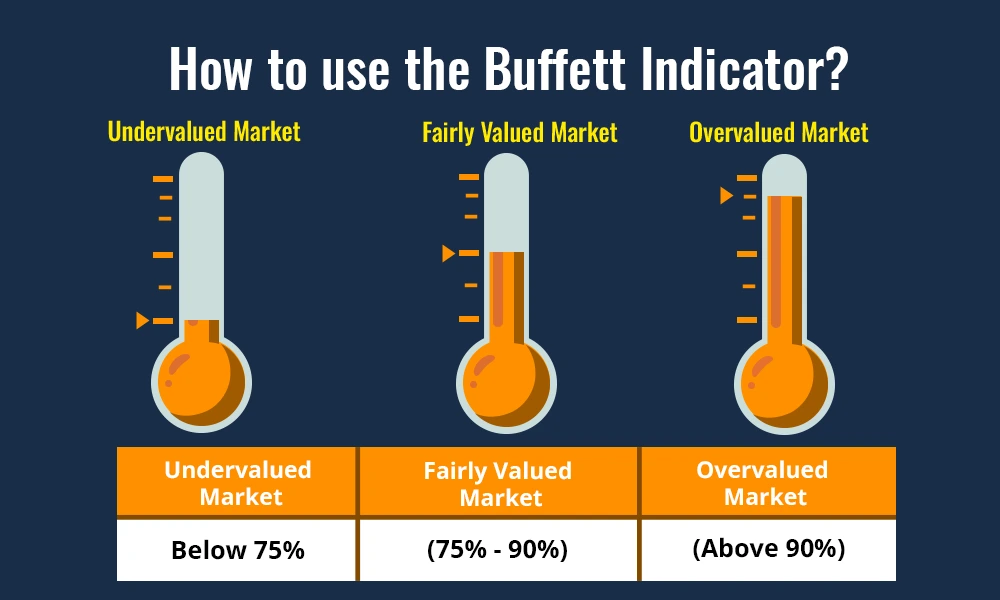
The Buffett Indicator can be used in the following manner for shaping the investment portfolio,
Undervalued Market (Below 75%) - If the Buffett Indicator is below 75%, it suggests the market might be undervalued. This could be a good time to buy stocks, as prices might rise in the future.
Fairly Valued Market (75% - 90%) - When the indicator is between 75% and 90%, the market is considered fairly valued. Investors might still find good opportunities but should be selective and focus on strong, well-performing companies.
Overvalued Market (Above 90%) - If the indicator exceeds 90%, the market might be overvalued. This suggests caution, as stock prices could be too high and might drop in the future. Investors might want to avoid buying or consider selling some of their holdings.
While the Buffett Indicator is helpful, it’s important to use it alongside other investment tools and indicators. For instance, considering company fundamentals, sector performance, and global economic conditions can provide a more complete picture and help make more informed decisions.
Finally, it is crucial to stay updated on the country’s economic growth and stock market trends, as these can influence the Buffett Indicator. Regularly checking the indicator can help investors adapt their strategies according to the market’s valuation.

The Buffett Indicator is widely used by investors across the globe to understand the overall perception of the market or the prevailing market sentiment. However, there are a few factors to consider while using the Bufet Indictor for its optimum interpretation. Here are a few such factors that can influence the calculation and interpretation of the Buffett Indicator.
When using the Buffett Indicator, investors should consider the country’s economic growth rate. A rapidly growing economy might justify a higher market capitalisation, making a high Buffett Indicator less concerning. It is important to understand that if the GDP is expected to grow significantly, a higher ratio might not indicate overvaluation.
Market sentiment plays a crucial role in shaping investment decisions. If investors are overly optimistic, stock prices might rise faster than economic growth, leading to a high Buffett Indicator. On the other hand, a negative sentiment could keep the ratio low even if the economy is strong. Thus, understanding market psychology can help interpret this indicator more accurately.
Interest rates can have a significant influence on stock valuations. An economy with lower interest rates can drive investors towards stocks, which can push market capitalisation higher and potentially increase the Buffett Indicator. Similarly, rising interest rates might lower stock prices, which can in effect reduce the ratio. Therefore, it is important to consider the interest rate environment when evaluating the indicator.
Global economic trends are also a crucial factor impacting the Buffett Indicator in an economy. For example, strong global markets might lead to higher valuations in a country, while global recessions could depress the overall market. Investors should, thus, have a broader outlook and consider how international factors might be influencing the local stock market when using the Buffett Indicator.
Another aspect most investors overlook is the structure of the stock market, including the dominance of certain sectors or companies, as it can also affect the Buffett Indicator. For example, if a few large companies drive most of the market capitalisation, the indicator might be skewed. Hence, investors should be aware of the market's composition to make a more informed assessment and also use fundamental analysis tools for a better evaluation of investment decisions.
The pros and cons of using the Buffett Indicator are explained hereunder.
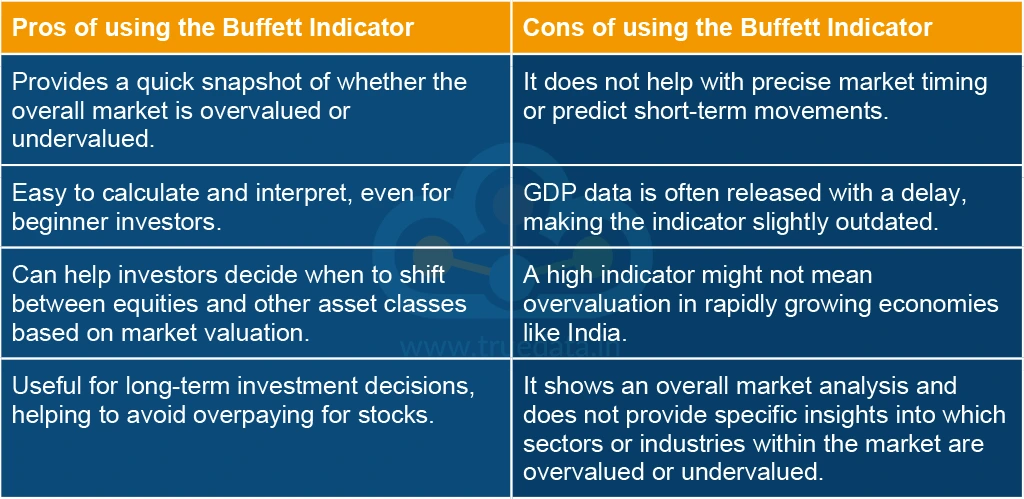
The Buffett Indicator is a valuable tool for investors to assess the overall stock market's valuation by comparing market capitalisation to GDP. It offers a broad view of whether the market is overvalued, fairly valued, or undervalued, helping investors make informed decisions, especially for long-term investing. While the Buffett Indicator is simple and effective for understanding market trends, it has limitations and, therefore, should not be used as a standalone indicator of market analysis or investment decisions.
This blog talks about the Buffett Indicator and using it in the investment strategy. Let us know if you have any queries on this topic or need information on more such indicators guiding investment decisions.
Till then, Happy Reading!
Read More: Best Financial Books for Traders

When we take our first step into the trading game, we choose the best resource...

Analysing the price direction is the holy grail of trading. To achieve this, t...
The key tosuccessful trading is understanding price variations and the degree of...