
Profitability in any company is a crucial metric for determining an investment decision. However, merely knowing that the company is making a profit is not enough. There are many layers to profitability, and DuPont Analysis is an important checkpoint for analysing them. Check out this blog to learn the meaning and importance of this concept and why it is important for companies and investors.
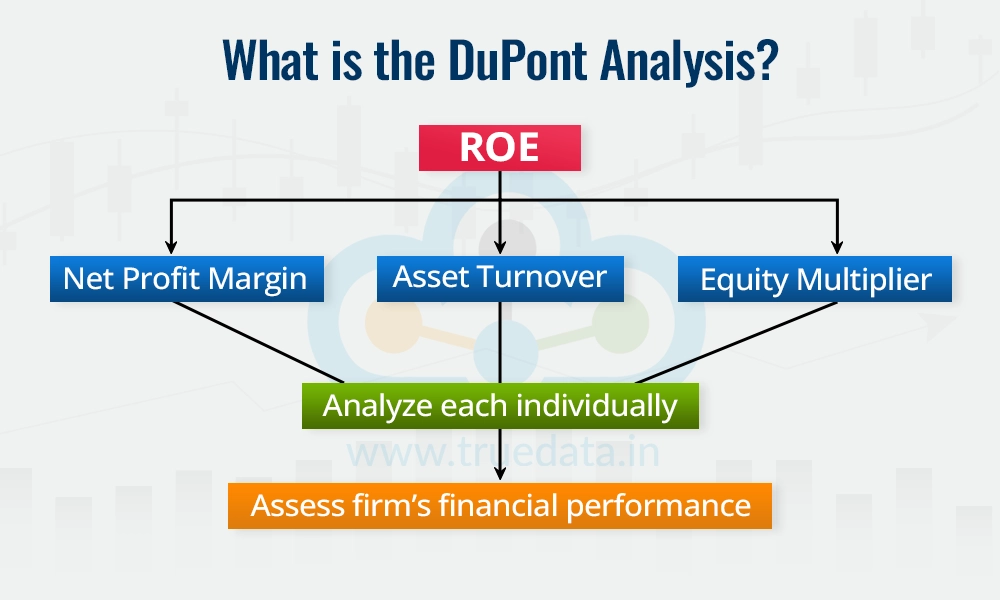
The shareholders of a company are its true owners and the primary agenda for any investor or owner is the return that their investment generates for them. The ROE (Return on Equity) Ratio is the yardstick that serves this purpose and allows the shareholders to know the return that the company can provide for their investment. However, this ratio alone provides limited information and no deeper insights. Enter DuPont Analysis!
DuPont Analysis is a financial tool that helps investors and companies understand how well a company is generating returns for its shareholders by breaking down the Return on Equity (ROE) into three key components, i.e., profitability (how much profit is earned from sales), efficiency (how well assets are used to generate revenue), and leverage (amount of borrowed money used to increase returns).
This method was developed by the DuPont Corporation, a chemical company in the United States, in the 1920s to evaluate its own performance and improve efficiency. Over time, it became widely used across industries as it provides a clear and detailed way to identify strengths and weaknesses in a company’s financial performance. Thus, DuPont Analysis can highlight areas for improvement, such as cost management or better use of resources, while investors can use it to make informed decisions by understanding what drives a company’s success.
As mentioned above, the DuPont Analysis Model Breaks down the Return on Equity (ROE) for better understanding. Let us first focus on the formula for ROE.
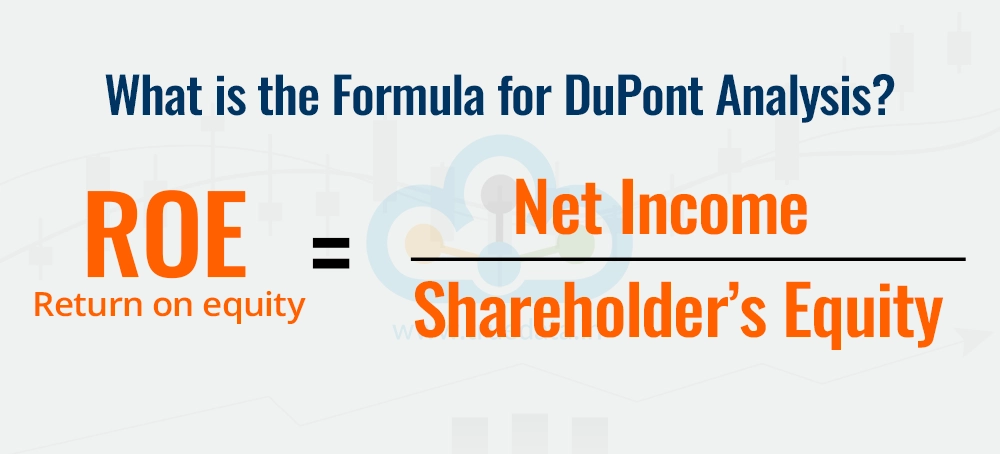
ROE (Return on Equity) = Net Income / Shareholder’s Equity
ROE formula as per the DuPont Analysis Model,
ROE = Net Profit Margin * Asset Turnover * Equity Multiplier
Or
ROE = (Net Income / Revenue) * (Revenue / Average Total Assets) * (Average Total Assets /
Average total Equity)
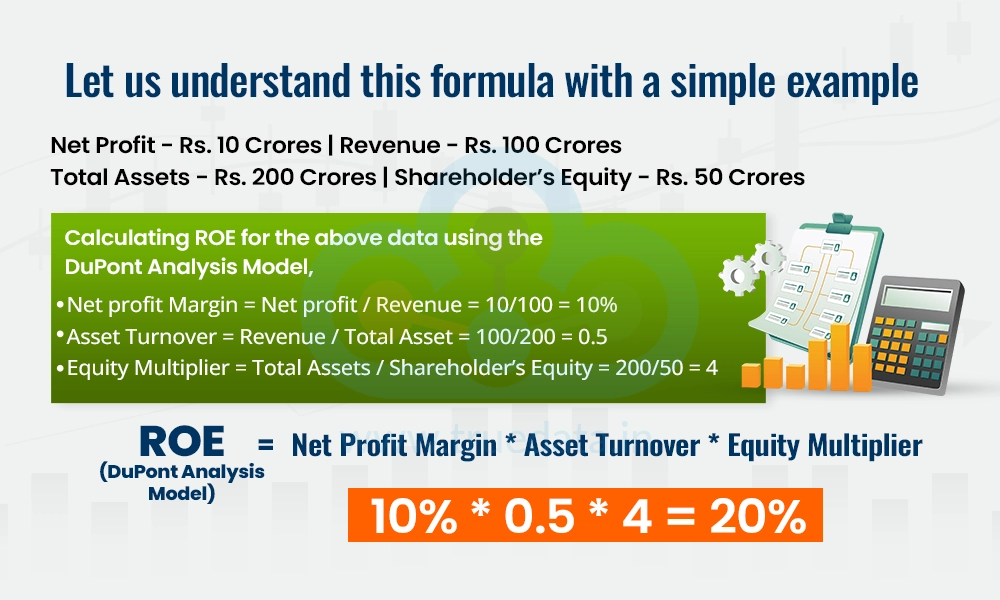
Consider Company XYZ with the following data,
Net Profit - Rs. 10 Crores
Revenue - Rs. 100 Crores
Total Assets - Rs. 200 Crores
Shareholder’s Equity - Rs. 50 Crores
Calculating ROE for the above data using the DuPont Analysis Model,
Net profit Margin = Net profit / Revenue = 10/100 = 10%
Asset Turnover = Revenue / Total Asset = 100/200 = 0.5
Equity Multiplier = Total Assets / Shareholder’s Equity = 200/50 = 4
ROE (DuPont Analysis Model) = Net Profit Margin * Asset Turnover * Equity Multiplier
ROE = 10% * 0.5 * 4 = 20%
The ROE of XYZ Ltd. is 20% which implies that it generates Rs. 20 in profit for every Rs. 100 of shareholder’s equity. Breaking this down using the DuPont Analysis.
A 10% profit margin shows good profitability.
An asset turnover of 0.5 suggests a scope to improve efficiency.
A high equity multiplier of 4 indicates significant use of debt, which could be a risk.
This detailed breakdown helps companies identify areas to improve, like better asset utilisation, while investors can evaluate whether the company's leverage is sustainable.
DuPont Analysis consists of three main components that break down Return on Equity (ROE) into distinct parts helping companies and investors understand what drives performance. Here is a detailed explanation of each of these components and their significance for investment decisions.
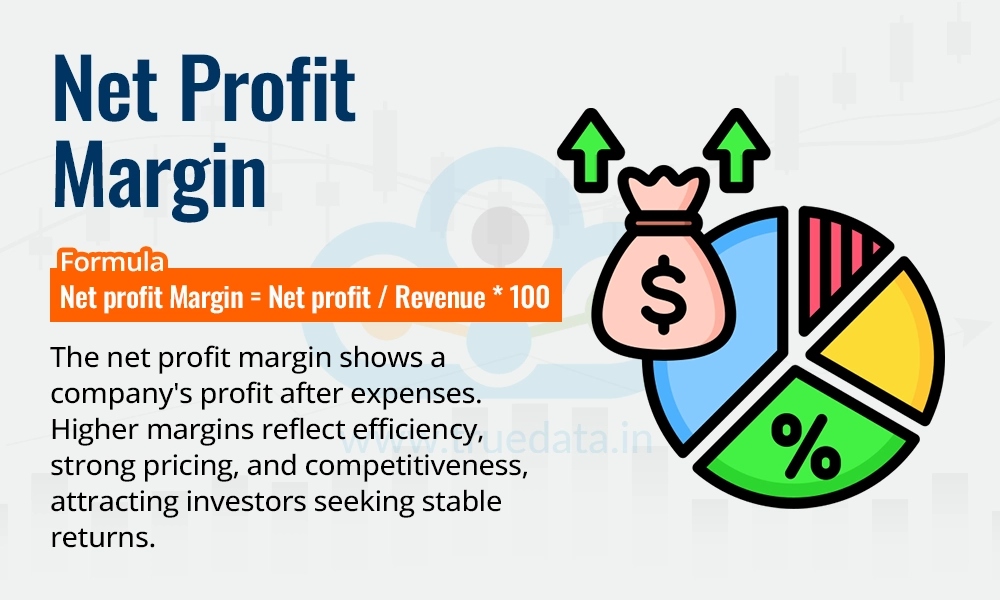
Net profit Margin = Net profit / Revenue * 100
The net profit margin measures the profit that a company earns from its revenues after covering all expenses, taxes, and costs. A higher profit margin indicates better control over expenses and strong pricing power. It reflects the company's ability to control costs and manage its operations efficiently. This margin helps companies identify cost inefficiencies and assess pricing strategies. Companies can use this measure to compare their margin to peers in the same industry to gauge competitiveness. Furthermore, a consistently higher margin shows a company’s ability to sustain profits even during tough times, making it more reliable for investment. Investors look for companies with stable or improving profit margins, as it shows the company is generating good returns from its sales making them a preferable investment option.
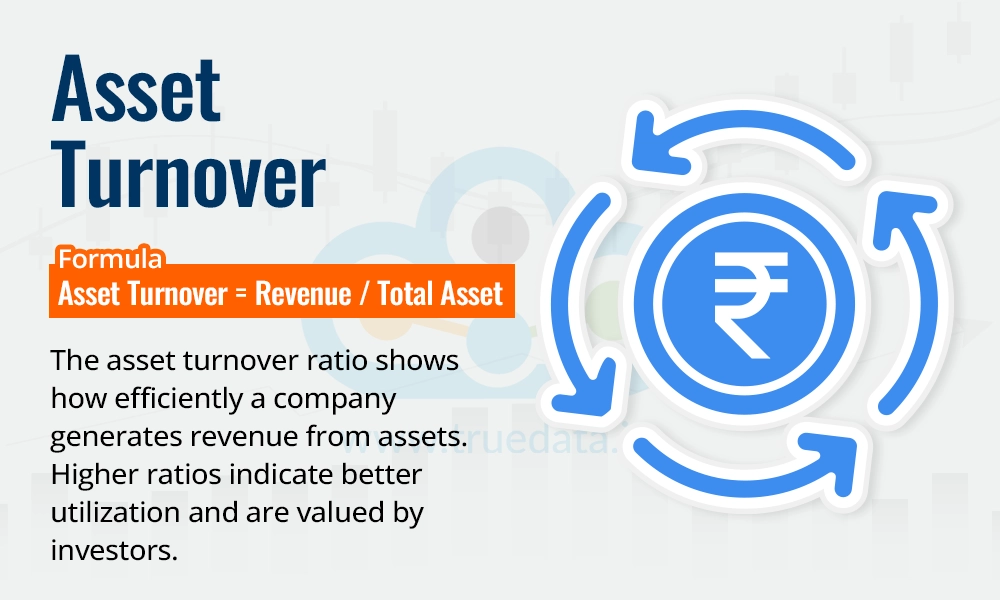
Asset Turnover = Revenue / Total Asset
The asset turnover ratio is a measure of how efficiently a company uses its assets to generate revenues. A higher can imply that the company is making better use of its investments in assets. Companies can use this to identify whether they are underutilising their assets, such as machinery, inventory, or real estate. companies in industries like retail or consumer goods typically have higher ratios due to frequent sales cycles, whereas industries like real-estate or heavy machinery might have lower ratios. Similarly, investors value a high asset turnover as it shows the company is maximising its asset potential.

Equity Multiplier = Total Assets / Shareholder’s Equity
The equity multiplier in the DuPont Analysis is used to measure the level of financial leverage highlighting how much of the company’s assets are funded by shareholders versus debt. A higher value of the Equity Multiplier, also known as Financial Leverage, indicates greater reliance on debt which can lead to financial distress, especially in volatile economic conditions. Investors should, therefore, check whether the company can handle its debt responsibly by gaining a holistic view of the company's financials and its historical performance. Investors can also use this metric to gauge the company’s risk profile where a moderate leverage is often preferred for sustainable growth.
The 5-step DuPont Analysis expands the traditional 3-step model by adding two more components, providing a deeper understanding of a company’s financial performance. It helps investors and companies analyse the factors driving profitability and efficiency in even greater detail by adding the additional components in the net profit margin breaking the further down. These additional components provide deeper insights into tax management, financing costs, and operational efficiency for companies and investors thereby increasing the efficiency in investment decisions.
The formula for the 5-Step DuPont Analysis Model is,
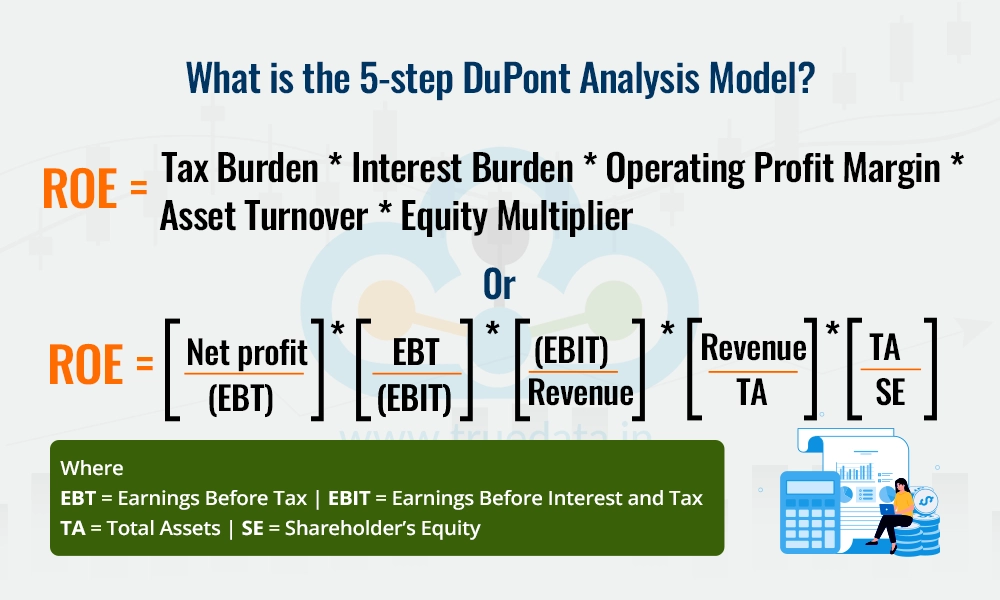
ROE= Tax Burden * Interest Burden * Operating Profit Margin * Asset Turnover * Equity
Multiplier
Or
ROE = [Net profit / Earnings Before Tax (EBT)] * [Earnings Before Tax (EBT) / Earnings
Before Interest and Tax (EBIT)] * [Earnings Before Interest and Tax (EBIT) /
Revenue] * (Revenue / Total Assets) * (Total Assets / Shareholder’s Equity)
The 5-step DuPont Analysis Model is crucial for both investors and companies because it provides a detailed breakdown of the factors influencing a company’s Return on Equity (ROE). It acts as a diagnostic tool for companies helping them identify specific areas to improve, such as reducing tax expenses, cutting interest costs, increasing operational efficiency, or better-utilizing assets. For example, if the tax burden ratio is low, the company could use this analysis to explore tax-saving strategies. The model also offers a deeper understanding for investors of a company’s financial health by showing how profits are generated and sustained. It highlights the quality of earnings, i.e., whether they come from operational efficiency, strong sales, or just high financial leverage. This is especially important in a country like India where industries face varying challenges like fluctuating tax policies, changing interest rates, or economic uncertainty. Thus, with a better understanding and interpretation of each component of the 5-Step DuPont Analysis Model, investors can assess risks and make informed decisions about where to invest. Ultimately, the 5-step DuPont Analysis provides a comprehensive view of what drives a company’s profitability and sustainability.
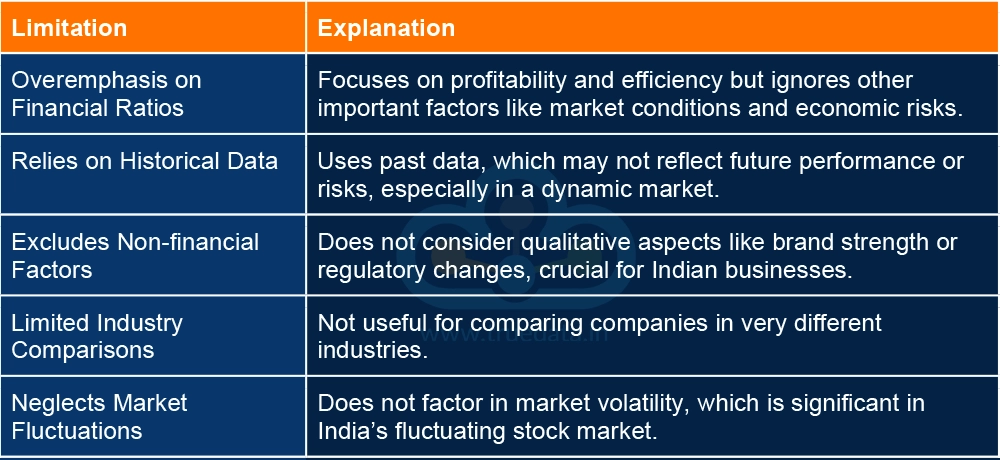
Some of the prime limitations of using the DuPont Analysis model includes,
DuPont Analysis is a traditional model yet an important aspect to understand the fundamental aspects of a company as well its financial health and viability. Despite its limitations, DuPont Analysis can shed deep insights into the profitability of a company making it an essential tool for making investment decisions at a micro as well as a macro level for companies as well as investors.
This article sheds light on an important aspect of the fundamental analysis of companies aiding in making informed investment decisions. Watch this space for more such topics on fundamental analysis of companies and enrich your investment journey! Also, let us know if you need any clarifications or more information on this topic and we will address that.
Till then Happy Reading!
Read More: Red Flags to Watch Out for While Analysing a Company’s Stock
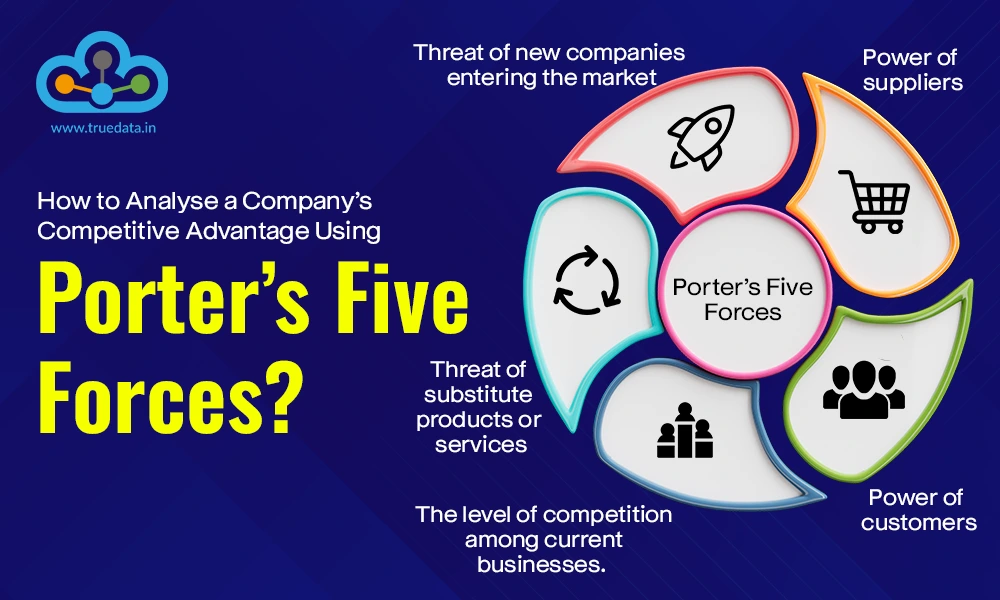
Imagine a business without any competition. What's the outcome? An unchecked mon...

If you are a shareholder of a company, you would have seen its annual reports co...

Did you know more than 5000 companies are listed on theBSE and about 2000 on the...