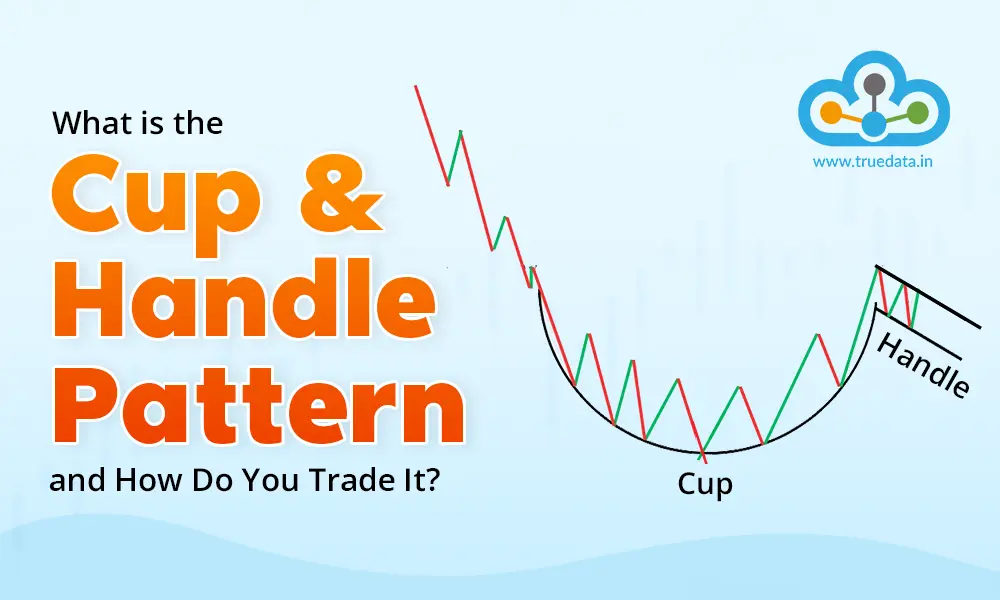
The realm of technical analysis has many tools and indicators that can be used for effective trading and having a robust investment portfolio. This includes various chart patterns and candlestick patterns as well that help investors make sense of the market movements and determine suitable entry-exit points. The cup and handle chart pattern is a popular chart pattern in technical analysis used by traders to make informed portfolio decisions. Check out this blog to know all about this chart pattern and how to trade using the same.
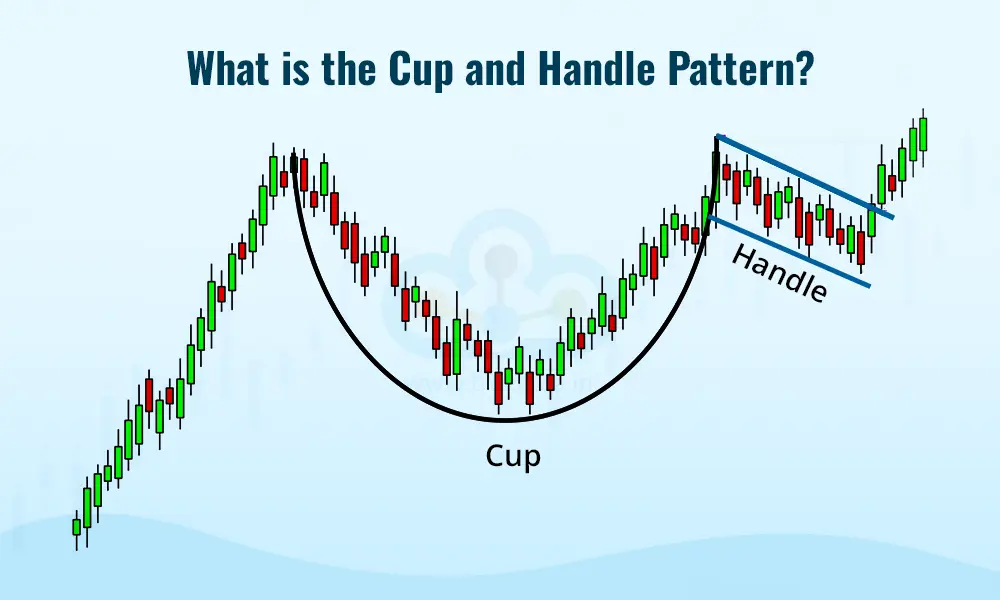
The cup and handle pattern is a decades-old chart pattern that was popularised by William J. O'Neil, a well-known investor and the founder of Investor's Business Daily. He introduced this concept in his book How to Make Money in Stocks, published in the 1980s. O'Neil observed that this pattern often appears in stocks before they make significant upward moves, especially when supported by strong trading volume during the breakout.
This pattern is used to identify potential bullish trends in stocks, commodities, or other financial instruments. The pattern gets its name due to its distinct resemblance to a cup with a handle when viewed on a price chart. The pattern begins with a rounded, U-shaped decline and recovery, forming the ‘cup’. After the cup is formed, there is a smaller, sideways or slightly downward consolidation phase, creating the ‘handle’. This handle typically represents a brief pause before the price breaks out in an upward direction.
Thus simply out, the cup and handle pattern signals that the market had some hesitation or pullback (forming the cup) but eventually gained confidence. The handle shows a final phase of consolidation before a likely breakout enabling traders to make informed portfolio decisions.
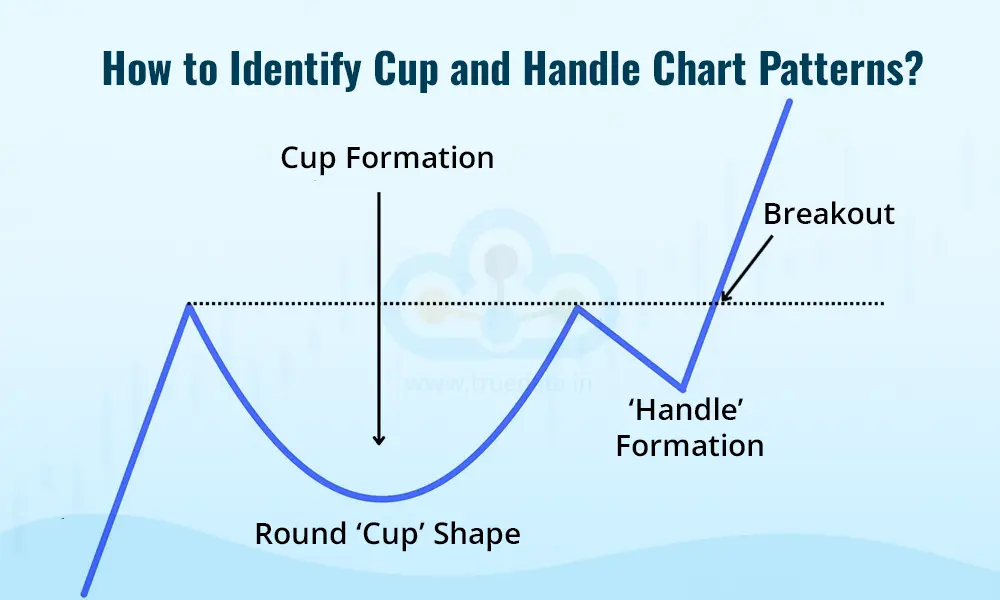
The cup and handle pattern indicates potential bullish opportunities and upward price movements. However, the key to trading efficiently using this pattern is to first identify it correctly. Here are the steps or the key points that are used to identify the cup and handle pattern.
The first step in identifying the cup and handle pattern is to look for the distinct ‘Cup’ formation. This formation is the unique ‘U’ formation that resembles the cup. This shape is formed when the price of the stock or asset drops gradually, finds a bottom and then rises back to approximately the same level as before the decline. This formation has the following typical characteristics.
The decline towards the ‘U’ formation should be gradual and not steep (resembling more like ‘V’)
The depth of the shape can typically range from 15% to 50% of the previous price movement
It is important to understand that a well-formed cup takes time to develop thereby indicating a healthy consolidation phase. This shows the gradual shift where the sellers lose steam and the buyers regain strength.
Following the cup formation, the next step in identifying this pattern correctly is the ‘handle’ formation. This formation indicates the short-term consolidation or the pullback phase. It shows the hesitation of traders before the price potentially breaks out. The key characteristics of this formation include,
The handle usually appears as a small, downward-sloping channel or sideways movement.
The handle formation should not be lower than 10-15% from the top of the cup.
The breakout is the most critical part of the Cup and Handle pattern. It occurs when the price breaks above the resistance level formed by the top of the cup. The key characteristics for breakouts in this pattern are,
The breakout should happen with strong trading volume, indicating buyer interest.
The price must close above the resistance level to confirm the breakout.
Like any other indicator or chart pattern, the cup and handle pattern should also be used after confirmation using other indicators like moving averages, and RSI indicators along with volume analysis. This pattern can be used for different time frames as well. While intraday traders can use this pattern for quick opportunities, swing and positional traders can use this pattern to reflect on stable trends.
Traders should also avoid common pitfalls like false patterns and low-volume breakouts that can lead to wrong decision-making. If the overall market is bearish then the cup and handle pattern does not hold well. Hence, traders need to focus on various aspects of this pattern to identify it correctly and make informed decisions.
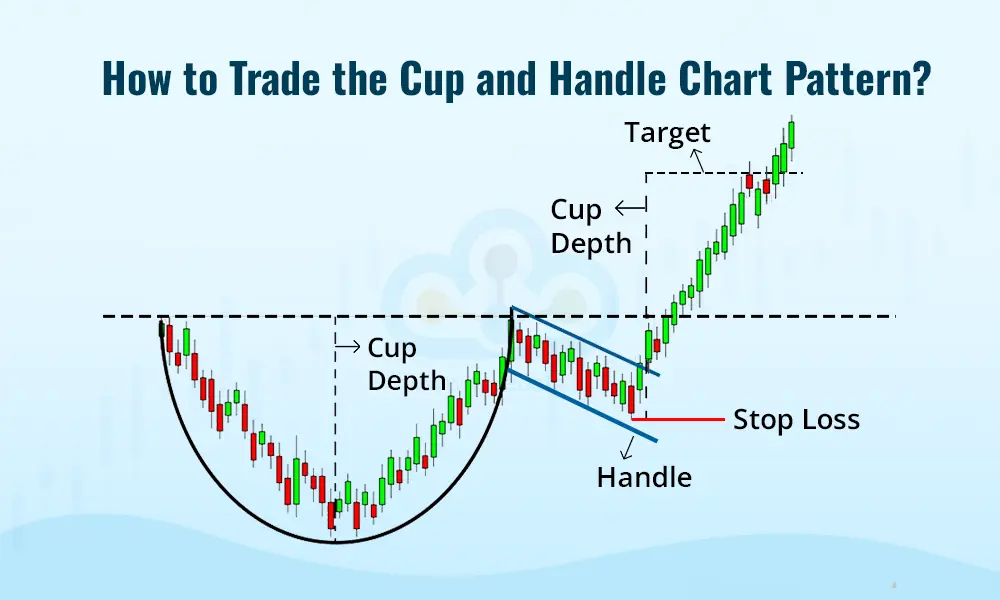
Traders can use this pattern to have a profitable strategy by identifying and confirming the pattern correctly and using it to trade successfully. Here are the brief steps that can be used for the same.
Identifying the pattern using the distinct ‘cup’ formation and the ‘handle’ formation.
Confirm that the cup is not too shallow or overly deep, and the handle is not too long.
The next step is to understand the key support and resistance levels. The resistance level is at the peak of the cup which is also like the breakout point and the support levels are at the bottom of the handle which can be used for stop-loss placement.
A significant trading volume coupled with a price surge at the breakout levels indicates strong buying interest.
The entry point can be at the price that closes above the resistance level.
Following this, the stop-loss order can be placed below the lowest point of the handle or slightly below the resistance line (now acting as support). This will help traders protect their capital in case of a failed breakout.
Set a target price and sell part of the holdings at the target price to lock in profits and use trailing stop-loss to capture additional gains if the price continues to rise beyond the target.
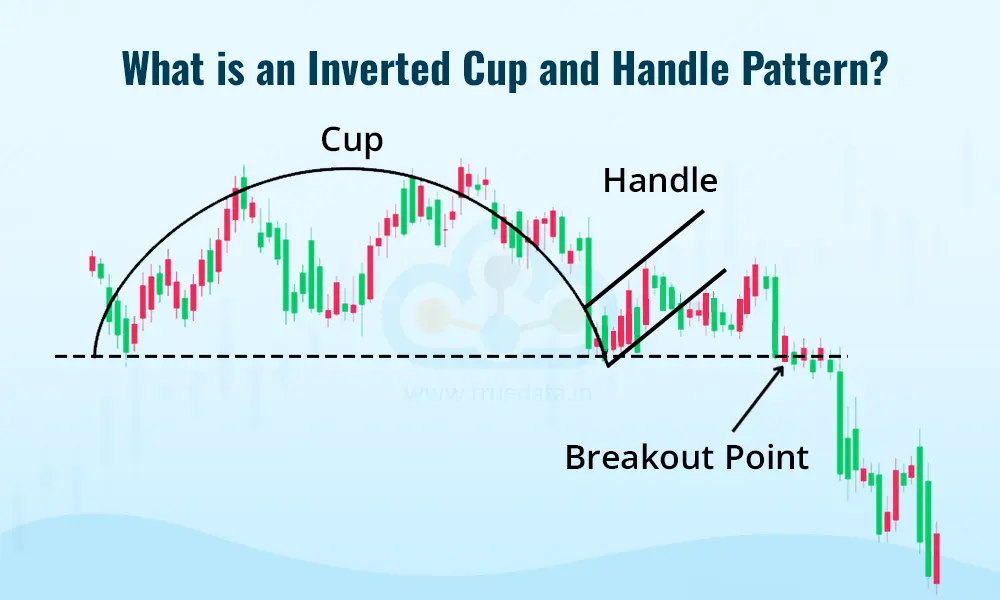
The Inverted Cup and Handle pattern is the bearish counterpart of the Cup and Handle pattern. It signals a potential downward trend in the price of a stock, commodity, or other financial instruments. The pattern forms when the price gradually rises and then falls, creating an upside-down "U" shape, which is the inverted cup. This formation is followed by a brief consolidation phase or slight upward retracement, forming the inverted handle. This handle usually represents a pause before the price resumes its downward trend. The pattern is complete when the price breaks below the support level formed at the bottom of the cup.
This pattern is used to anticipate selling opportunities, especially in bearish markets or when the overall sentiment is negative. It suggests that buyers are losing strength, and sellers are likely to gain control. Traders can confirm this pattern by looking for a breakdown below the support level, ideally accompanied by increased selling volume. However, it is also essential to use other indicators and chart patterns to confirm this pattern similar to the cup and handle pattern.
Like any other technical analysis pattern, the cup and handle pattern also has many pros and cons of using this pattern. Traders should have a thorough analysis of the same before using this pattern to have a sound portfolio.
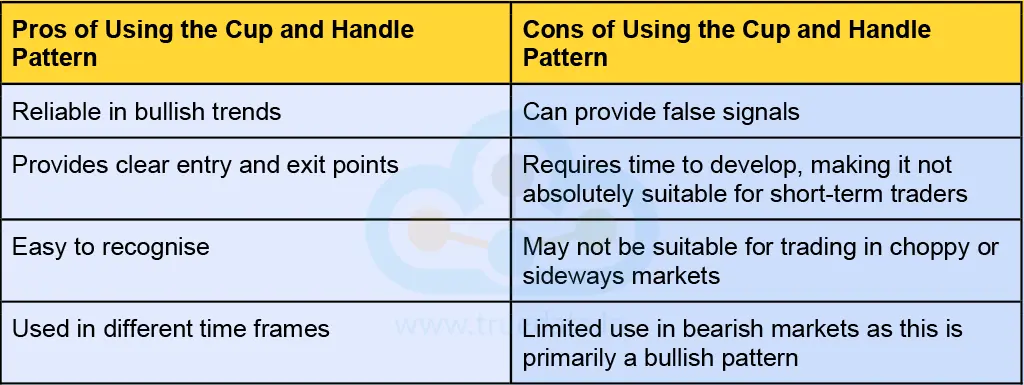
The cup and handle pattern is a valuable tool for traders to identify bullish trends and price movements in stock markets. The pattern can help traders identify clear entry and exit points as well as stop loss levels to minimise losses and maximise profits from the trades. This pattern can help traders in short-term as well as long-term trading ensuring enhanced decision-making in different time frames and improving their chances of success in bullish market conditions.
This article talks about yet another important trading pattern of technical analysis. Did you know about this pattern or have been trading using it? Let us know your thoughts or any points to add to this topic and we will discuss them.
Till then Happy Reading!

The use of technical analysis for trading is vital for creating a successful tr...
Candlestick patterns are among the most basic and common tools traders use to cr...
Stock markets have been under a lot of pressure in the past week and investors ...