 When we talk about the top technical indicators, the name Stochastic oscillator is used among the most popular and widely used ones. But for new traders, this may seem a very technical term that sounds too difficult to understand and use in their daily trading. Are you among them? Do not worry as we have got you covered. Check out this blog to understand the meaning of stochastic oscillator and its related details. Read More: Bollinger Bands - All you need to know
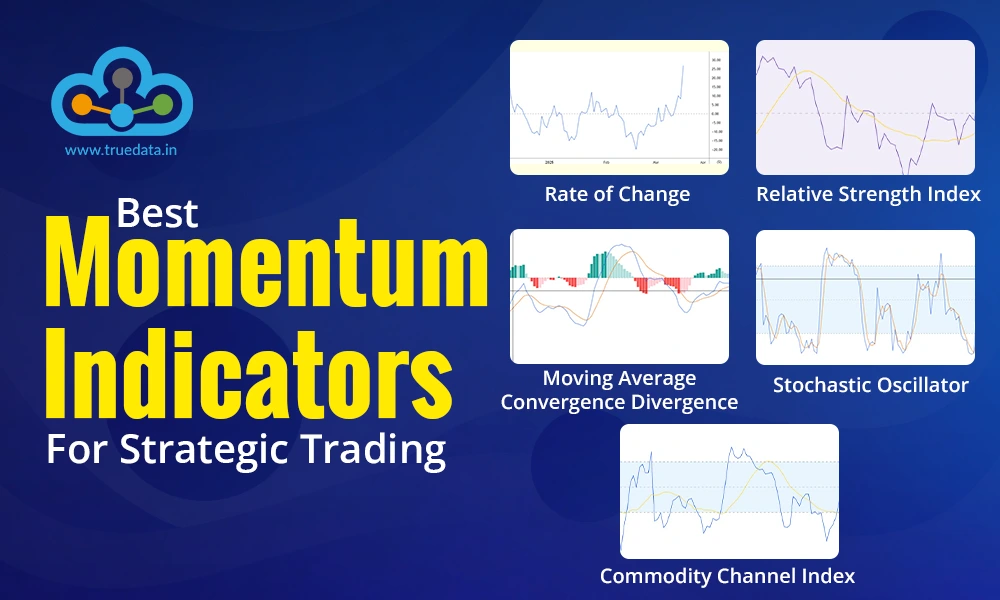
The stochastic oscillator is a popular technical analysis tool used by traders and analysts in financial markets to assess the momentum and strength of price movements. It was developed by George C. Lane in the 1950s. The stochastic oscillator is primarily used to identify overbought and oversold conditions in a market, which can help traders make informed decisions about buying or selling assets. The concept behind the stochastic oscillator revolves around the idea that in an uptrending market, prices tend to close near their high, while in a downtrending market, prices tend to close near their low. The stochastic oscillator compares the current closing price of an asset to its price range over a specified period of time. This period is typically set to 14 days, but it can be adjusted based on the trader's preference. This comparison helps determine whether the asset is trading near its recent high or low and thus provides insights into potential reversals or continuation of trends.
 The concept of a Stochastic Oscillator involves the calculation of a %K line and %D line. The formula for these lines and their interpretation is given below. the formula for calculating %K: %K = (Current Close Price - Lowest Low Price in the Period) / (Highest High Price in the Period - Lowest Low Price in the Period) × 100 Let's break this down with an example: Suppose you're a trader analysing the stock of a company over a period of 14 days. You've collected the following price data: Highest High Price in the Period (14 days): Rs. 1500 Lowest Low Price in the Period (14 days): Rs. 1200 Current Close Price: Rs. 1400 Now, plug these values into the formula: %K = (1400 - 1200) / (1500 - 1200) × 100 %K = 200/300 *100 ˜ 66.67% So, in this example, the %K line of the Stochastic Oscillator would be approximately 66.67%. Now, to calculate the %D line, you'll typically use a 3-day Simple Moving Average (SMA) of the %K values. Let's say you've calculated the %K values for the past 3 days as follows: Day 1: 70% Day 2: 60% Day 3: 75% Calculate the average: %D = (70+60+75) / 3 = 205/3 ˜ 68.33% So, in this example, the %D line of the Stochastic Oscillator would be approximately 68.33%. Interpretation:
The stochastic Oscillator is essentially to identify the overbought and oversold levels of the security. This indicator can be interpreted and used in the following manner.


 Traders often use the Stochastic Oscillator in conjunction with other technical indicators. For example, using moving averages can help confirm trends and support/resistance levels can indicate potential turning points in the market. This comprehensive approach helps traders make more informed decisions by considering multiple perspectives.
 It's important to confirm Stochastic Oscillator signals with the overall price action of the asset. Traders should ensure that the asset's price movement aligns with the direction suggested by the oscillator. This confirmation can reduce the risk of false signals and improve the accuracy of trading decisions.
 To manage risk, traders should set stop-loss orders at levels that align with their risk tolerance. Position sizing should be determined based on the amount of capital a trader is willing to risk on a particular trade. Effective risk management is crucial for protecting capital in case the trade goes against expectations.
 Using the stochastic oscillator has many benefits and shortcomings. It is important for traders to understand them in order to use them effectively and make a successful trading portfolio.
A few benefits of using the stochastic oscillator are given below.
The Stochastic Oscillator is a powerful tool for identifying optimal entry and exit points in the market. By assessing overbought and oversold conditions, traders can gauge potential price reversals and corrections, allowing them to enter or exit positions with greater precision.
The oscillator is adept at providing early signals for potential trend reversals. It can help traders anticipate shifts in market sentiment and adjust their strategies accordingly, leading to timely actions that capitalise on emerging trends.
The Stochastic Oscillator's concept is relatively easy to grasp. Its readings revolve around the overbought and oversold levels, simplifying the interpretation process for traders, regardless of their experience level. This makes it highly acceptable and approachable even for beginners.
The Stochastic Oscillator's versatility lies in its applicability across various timeframes, making it suitable for intraday, short-term, and long-term trading strategies. Furthermore, traders can customise the indicator's parameters to align with their preferred trading style and the specific market's characteristics.
The Stochastic Oscillator can be employed as a confirmation tool in conjunction with other technical indicators or patterns. When its signals align with signals from other sources, it bolsters the trader's confidence in their decision-making process.
A few shortcomings of using the stochastic oscillator are given below.
The Stochastic Oscillator is a lagging indicator, which means it relies on past price data to generate signals. As a result, it might not provide timely warnings of sudden market shifts, especially during periods of rapid price movements.
In markets characterised by sideways or choppy movements, the Stochastic Oscillator is prone to generating false signals. These signals can lead to whipsaw trades, where positions are opened and closed rapidly, resulting in losses.
The oscillator's effectiveness can wane in certain market conditions, such as periods of low volatility. It might provide less reliable signals when markets lack a clear direction or during quiet trading sessions.
While divergence can be a valuable signal for trend reversals, it's not foolproof. Sometimes, a divergence between the price and the Stochastic Oscillator may not result in an actual reversal, leading to potential misinterpretation and erroneous trading decisions.
The Stochastic Oscillator can be a valuable tool for traders in India to identify potential overbought/oversold levels, trend reversals, and market momentum shifts. To maximise its effectiveness, traders should consider combining it with other indicators and practising proper risk management techniques. Additionally, continuous learning and adapting to changing market conditions are crucial for successful trading using the Stochastic Oscillator or any other trading tool. We hope this article was able to provide you with the basic details of the stochastic oscillator and simplify the same for you. Let us know if you have any queries about the same or need more information on this topic. Till then Happy Reading!
Marisha Bhatt is a financial content writer @TrueData.
She writes with the sole aim of simplifying complex financial concepts and jargon while attempting to clarify technical and fundamental analysis concepts of the stock markets. The ultimate goal is to spread vital knowledge and benefit the maximum audience. Her Chartered Accountant background acts as the knowledge base to help clarify crucial concepts and create a sound investment portfolio.
The key tosuccessful trading is understanding price variations and the degree of...
It is a fact that technical analysis is the basis of analysing stocks. What does...
When we take our first step into the trading game, we choose the best resource...