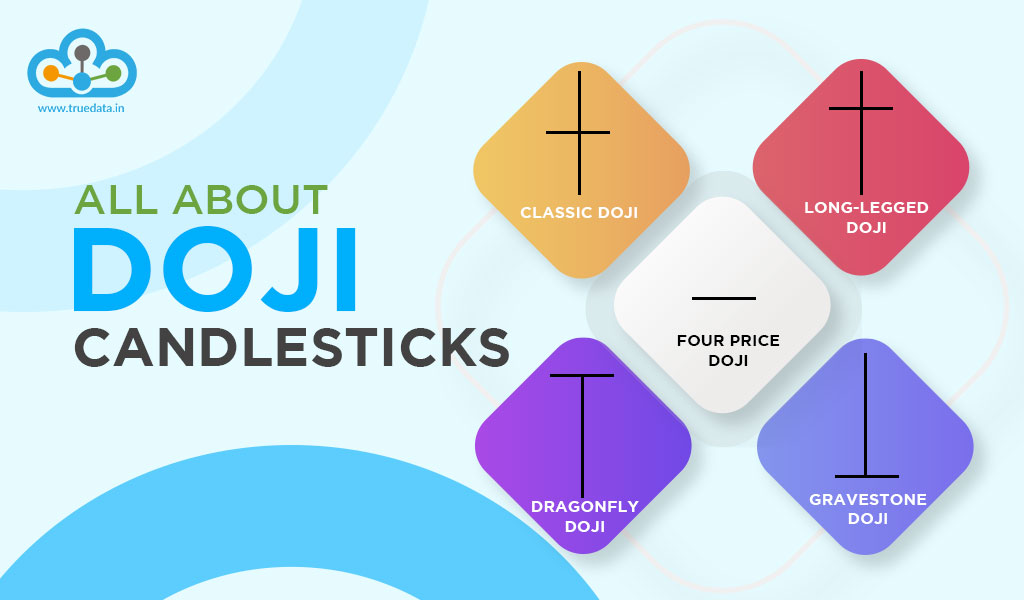
 We have discussed candlestick patterns and their importance in trading in our previous blogs. The discussion of candlestick patterns is incomplete without the mention of doji candlesticks as they are commonly used by traders across the world. Let us know more about doji candlesticks in this blog and their related details.
A doji candlestick is formed when the opening and closing prices of an asset are very close, creating a small or almost nonexistent body that resembles a cross or plus sign. The length of the upper and lower shadows, or wicks, can vary. Doji candlesticks indicate uncertainty and a possible change in market direction. They suggest that buyers and sellers are evenly matched, with neither side having control over the price. This pattern reflects indecision and can be a signal that a trend is losing momentum or a new trend is beginning to form.
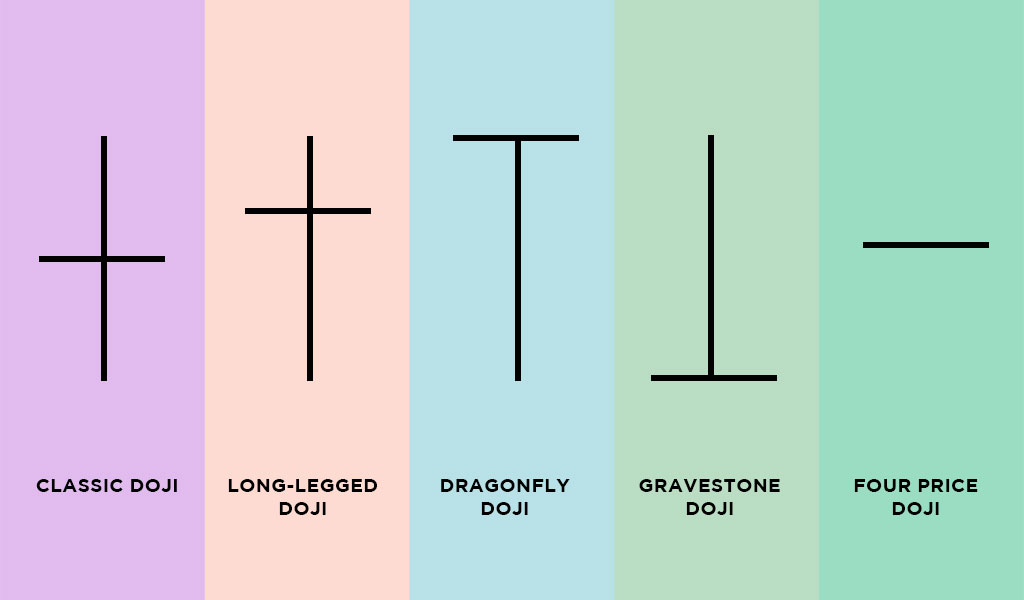 Some of the key doji candlestick patterns and their details are mentioned below.
The classic doji is a candlestick pattern characterized by a small body with opening and closing prices that are very close or equal. It represents a state of market indecision where buyers and sellers are evenly matched. The pattern suggests a potential trend reversal as it indicates that neither the bulls nor the bears have control over the price. Traders often interpret the classic doji as a signal to exercise caution and look for confirmation from other indicators before making trading decisions.
The long-legged doji is identified by its long upper and lower shadows, indicating high volatility and uncertainty in the market. It signifies that despite significant price movement, the opening and closing prices are relatively close. This pattern reflects a tug-of-war between buyers and sellers, with neither side having a clear advantage. The long-legged doji suggests that a trend may be losing its strength and that a reversal could be imminent. Traders often interpret this pattern as a sign to closely monitor the market for potential changes in direction.
The gravestone doji is characterized by a small or nonexistent lower shadow and a long upper shadow. It gets its name from its resemblance to a gravestone. This pattern indicates a potential trend reversal from bullish to bearish. The long upper shadow suggests that buyers pushed the price up during the trading session, but ultimately, sellers regained control, pushing the price back down. Traders often see the gravestone doji as a warning sign of a possible downtrend and may consider taking bearish positions or tightening stop-loss levels.
The dragonfly doji exhibits a small or nonexistent upper shadow and a long lower shadow. It resembles a dragonfly, hence its name. This pattern indicates a potential trend reversal from bearish to bullish. The long lower shadow implies that sellers drove the price down initially, but buyers regained control, pushing the price back up. Traders often interpret the dragonfly doji as a bullish signal, suggesting a possible upward reversal. However, it is crucial to consider confirmation from other indicators before making trading decisions.
The four-price doji occurs when the opening, closing, high, and low prices are all the same. It represents a state of complete market indecision and suggests that neither buyers nor sellers had control over the price during the trading session. This pattern indicates a temporary equilibrium in the market and may signal a potential trend reversal. Traders often interpret the four-price doji as a signal to exercise caution and look for additional confirmation from other technical indicators or patterns.
 Traders can use the Doji candlestick patterns for trading and understanding the position of the stock or the security in the market using the following steps.
 It is important to understand the pros and cons of using doji candlesticks to effectively use them and create a trading portfolio. Given here are the pros and cons of using doji candlesticks for trading.
Some of the advantages of using doji candlesticks are mentioned below.
Doji candlestick patterns can provide clear signals of potential trend reversals. When a doji forms after a prolonged trend, it indicates a potential shift in market sentiment, allowing traders to anticipate and take advantage of the reversal.
Doji patterns visually represent market indecision. The small or nonexistent body of the doji indicates that buyers and sellers are evenly matched, resulting in a balance of power. This visual representation helps traders identify situations where the market lacks direction, potentially signalling an upcoming change in trend.
Doji candlestick patterns can act as early warning signs of trend exhaustion or potential trend reversals. When a doji appears, it suggests that the prevailing trend may be losing strength or reaching its limit. This gives traders an opportunity to prepare for potential reversals and adjust their trading strategies accordingly.
Doji patterns can be used in conjunction with other technical indicators or patterns to increase the probability of accurate trading signals. By combining the insights provided by doji patterns with other indicators, such as trendlines, moving averages, or volume analysis, traders can gain a more comprehensive understanding of the market and make more informed trading decisions
Some of the key disadvantages of using doji candlesticks are mentioned here.
While doji patterns indicate potential trend reversals, they may not provide precise timing for entering or exiting trades. Traders should use other tools and indicators to refine their entry and exit points for better precision.
Doji patterns can occasionally generate false signals, leading to incorrect trading decisions if used in isolation. The presence of a doji does not guarantee a trend reversal, and traders should seek confirmation from other indicators or patterns before making trading decisions.
The interpretation of doji patterns can vary among traders. Different traders may have different criteria or thresholds for identifying and interpreting doji patterns, leading to subjective assessments of market conditions.
Relying solely on doji candlestick patterns for trading decisions may not always yield consistent results. Market dynamics involve multiple factors beyond candlestick patterns, and traders should consider a holistic approach by incorporating other technical analysis tools and fundamental analysis.
The use of doji candlesticks for trading is quite popular and widely used by traders across countries. Therefore, it is important to first understand these patterns and learn to identify them to understand market movements. We hope this blog was able to provide you with a basic understanding of Doji candlestick patterns. Let us know if you want to learn about the individual candlesticks mentioned here in more detail and we will take them up in future blogs. Till then Happy Reading!
Candlestick patterns are among the most basic and common tools traders use to cr...
Stock markets have been under a lot of pressure in the past week and investors ...
Stock investing and trading are becoming primary and secondary sources of income...