 Understanding the concept of technical analysis is an essential rite of passage for any trader. This includes understanding various indicators and strategies that help in understanding the price and volume movements, trends, and potential trend reversals. One of the popular indicators under technical analysis is the ADX indicator which is used widely used among new and seasoned traders. Given here is the meaning of this indicator and related details of the same. Read More: What is the marubozu candlestick pattern?
The ADX indicator, which stands for Average Directional Index, is widely used in financial markets as a tool for technical analysis. Its primary purpose is to assess the strength and direction of a trend in order to assist traders in determining whether an asset is experiencing a clear trend or is moving within a range. By utilizing the ADX indicator, traders gain valuable insights into the market's behaviour. It consists of three lines: ADX, +DI, and -DI. The ADX line represents the overall strength of the observed trend, while the +DI line measures the strength of the upward movement, and the -DI line gauges the strength of the downward movement. The ADX indicator is a valuable tool for traders in assessing the strength and direction of a trend and thereby aiding in making informed trading decisions. When used in conjunction with other technical analysis tools, the ADX indicator can enhance trading strategies and improve overall trading outcomes.
To calculate the ADX indicator, you need to perform several calculations. Here are the steps involved:
In these formulas:
By following these steps and formulas, you can calculate the ADX indicator, which provides insights into the strength and direction of a trend in the market.
The ADX indicator ranges between 0-100 and the interpretation of the value of the ADX indicator is explained below.
 When the ADX value is below 25, it suggests a weak or absent trend. The market may be ranging or experiencing choppy price movements rather than following a clear trend. Traders should exercise caution and consider alternative strategies suitable for range-bound conditions.
 ADX values within this range indicate a moderate to strong trend. A rising ADX line suggests increasing trend strength. Traders may consider entering trades in the direction of the trend, using appropriate entry and exit signals aligned with their trading strategy.
 ADX values above 50 indicate a very strong trend. This suggests a high level of trend strength and reliability. Traders may look for opportunities to ride the trend and consider holding positions for longer durations, using trailing stops to protect profits.
 Pay attention to the +DI and -DI lines. When the +DI line crosses above the -DI line, it suggests a bullish trend, indicating potential buying opportunities. Conversely, when the -DI line crosses above the +DI line, it signals a bearish trend, indicating potential selling opportunities.
 values") The DX value, derived from the difference between +DI and -DI, provides insights into the momentum of the trend. Higher DX values indicate stronger momentum and a more pronounced trend.
The DX value, derived from the difference between +DI and -DI, provides insights into the momentum of the trend. Higher DX values indicate stronger momentum and a more pronounced trend.
 Monitor for any divergences between the price action and the ADX indicator. If the price is making higher highs or lower lows, but the ADX is not confirming the trend strength, it could suggest a potential weakening of the trend or an upcoming reversal. The ADX indicator is not a directional indicator itself but rather measures the strength and presence of a trend. It is often used in combination with other technical analysis tools and indicators to make informed trading decisions.
 Some of the benefits and limitations of using the ADX indicator are highlighted hereunder.
Some of the benefits or advantages of using the ADX indicator include,
Some of the limitations of using the ADX indicator include,
The ADX indicator is one of the more popular indicators used by traders to understand the price movements and take suitable trading positions. However, it has certain limitations as well, therefore, it is important that the ADX indicator should not be used in isolation. Traders should use the ADX indicator along with other technical analysis tools to confirm their analysis and the trading decisions to create a healthy trading portfolio. We hope this article was good enough in providing a basic understanding of the ADX indicator. Let us know if you have any queries relating to the ADX indicator or if you want to have information about any other technical analysis tool or indicator. Till then Happy Reading!
Marisha Bhatt is a financial content writer @TrueData.
She writes with the sole aim of simplifying complex financial concepts and jargon while attempting to clarify technical and fundamental analysis concepts of the stock markets. The ultimate goal is to spread vital knowledge and benefit the maximum audience. Her Chartered Accountant background acts as the knowledge base to help clarify crucial concepts and create a sound investment portfolio.
nice
Thank you so much Sir!
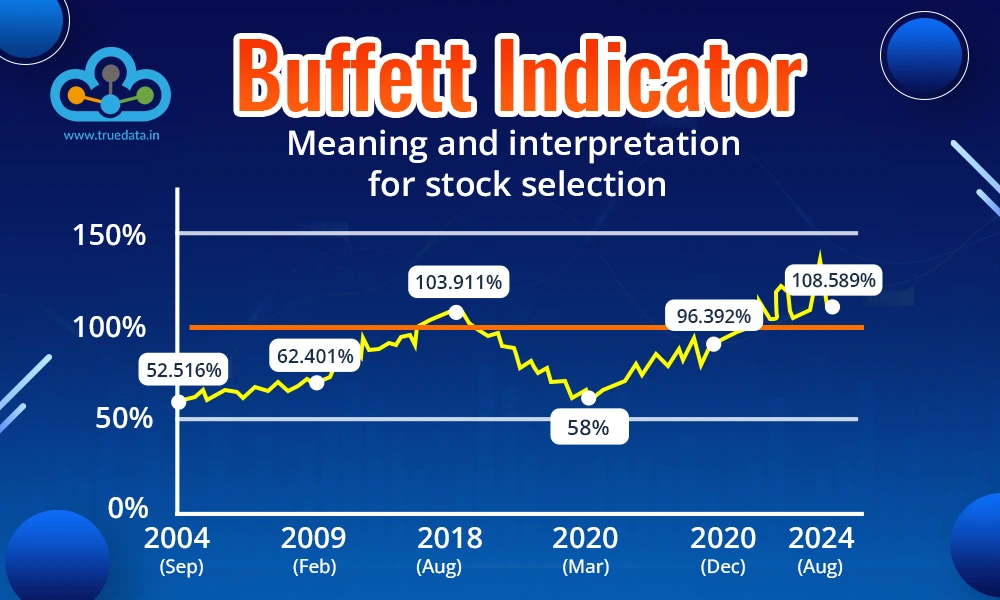
What is one of the deciding factors while investing in a stock? It is its valuat...
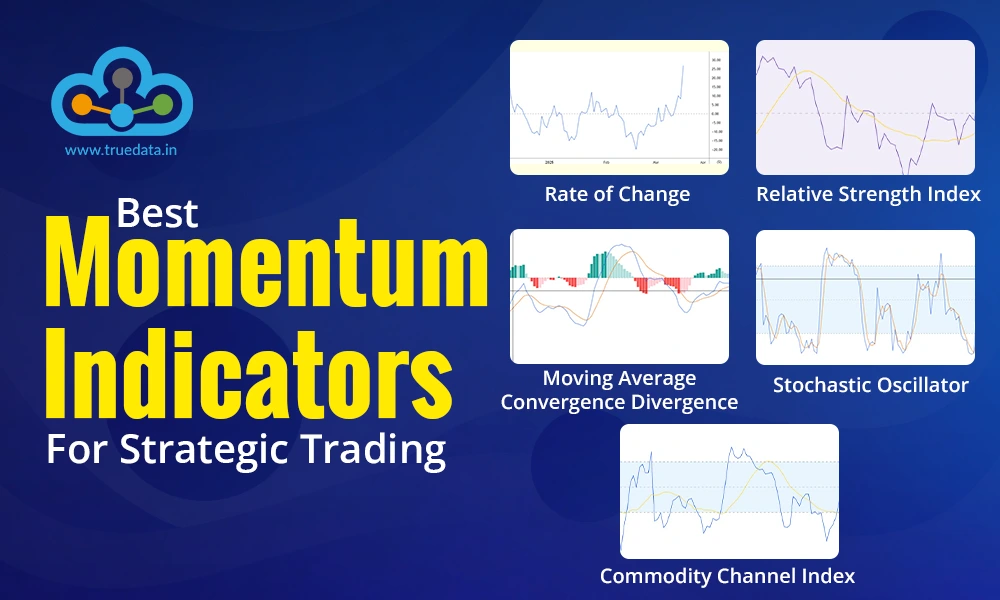
The key tosuccessful trading is understanding price variations and the degree of...
When we take our first step into the trading game, we choose the best resource...